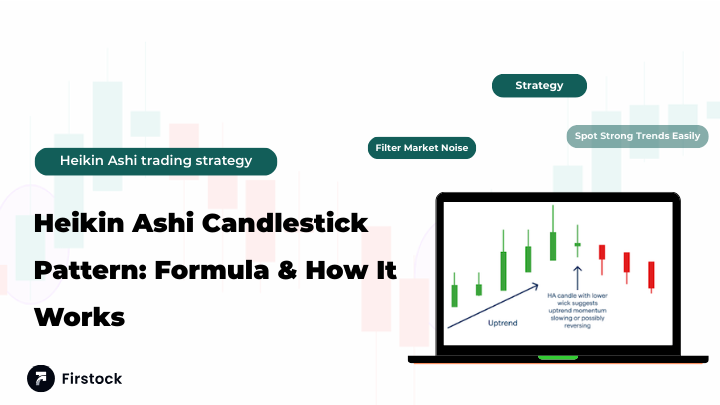
Heikin Ashi Candlestick Pattern: Formula & How It Works
Heikin Ashi Candlestick Pattern: How to Finally Filter Out the Market Noise
If you have spent any amount of time staring at standard candlestick charts, you already know how chaotic they can get. One minute the candle is green, the next it’s red, then it gaps up only to suddenly reverse. It’s messy. It’s loud. And if you’re like most traders, that constant noise manipulates your emotions — pushing you into decisions you later regret, such as exiting a perfectly good trade just because of one alarming red bar.
If you are tired of getting chopped up by pure market indecision, it's time to change how you view price action.
Get the Heikin Ashi candlestick pattern.
Imagine the noise-cancelling headphones on your charts. The wild spikes, the unpredictable motions and emotional traps are all brought to silence. Heikin Ashi does not only appear to smooth the chaos, but it also provides a clear picture of the true direction of the trend in a manner, which normal candles cannot possibly achieve.
Throughout this detailed guide, we will deconstruct the concept of the Heikin Ashi candlestick, the Heikin Ashi candle formula and how to read the Heikin Ashi candlesticks and have confidence in the Heikin Ashi candlestick as well as a no-nonsense Heikin Ashi trading strategy that you can begin to use today.
What Is Heikin Ashi Candlestick?
Heikin Ashi candlesticks are trend smoothing candlesticks that are based on average price rather than raw price.
This is useful in reducing the noise, showing trends and simplifying charts to read in comparison to normal candlestick patterns.
When ordinary candles present all the ticks and twitches in the market, a Heikin Ashi chart eliminates all the distractions and presents only the average rate of price action, which provides you a far better perspective of the trend.
What Does “Heikin Ashi” Mean?
“Heikin Ashi” translates to “Average Pace” in Japanese. And that name is perfect because the candles literally calculate and display the average movement rather than the raw, unfiltered market price.
Here’s the key difference:
Regular Candlesticks
- Show every single move
- Capture all volatility
- Great for precision
- Bad for emotional traders who get shaken out easily
Heikin Ashi Candlesticks
- Smooth out volatility
- Hide minor pullbacks
- Highlight trend direction
- Easier for beginners to read
Imagine watching a runner. A regular candlestick chart shows every stumble, every misstep, every shoelace retie. A Heikin Ashi chart only shows the direction they’re running.
This is why trend traders love using Heikin Ashi — you see the big picture, not the noise.
The Heikin Ashi Candle Formula (The “Secret Sauce”)
Unlike traditional candles that rely on raw OHLC values, Heikin Ashi candles are mathematically linked to the previous candle, which is why they appear so smooth.
You don’t need to memorize the formula, but understanding it helps you appreciate why Heikin Ashi reduces noise so well.
Heikin Ashi Close
Average of the current period’s Open + High + Low + Close ÷ 4
Heikin Ashi Open
Midpoint of the previous candle’s (Open + Close) ÷ 2
This is why you almost never see gaps on a Heikin Ashi chart. Every candle begins where the previous candle theoretically settled.
Heikin Ashi High
The highest value among High, HA-Open, HA-Close
Heikin Ashi Low
The lowest value among Low, HA-Open, HA-Close
Because these values are blended, a wild gap up in the real market may appear as a smooth continuation on your Heikin Ashi chart — keeping you calm while others panic.
How to Read Heikin Ashi Candlesticks
Forget memorizing dozens of patterns like Three Black Crows or Abandoned Baby. With Heikin Ashi candlesticks, there are only three signals you truly need.
1. Green Candle With No Lower Wick = Strong Uptrend
When you see green Heikin Ashi candles with flat bottoms (no wicks), buyers are fully in control.
What this means
The trend is strong. The market is accelerating upward.
Your move
Sit tight. Do not sell early. Let profits run.
This is the biggest advantage of Heikin Ashi — emotional discipline becomes easier.
2. Red Candle With No Upper Wick = Strong Downtrend
When you see red candles with flat tops (no wicks), it signals total seller dominance.
What this means
Momentum is bearish and accelerating downward.
Your move
Hold your short position. Do not try to catch a falling knife or buy the dip yet.
3. Small Body + Upper & Lower Wicks = Trend Exhaustion (Doji-Type Candle)
These candles indicate confusion, imbalance, and potential reversal.
What this means
The trend may be losing strength. Buyers and sellers are fighting.
Your move
Tighten your stop-loss. Prepare to exit. Wait for confirmation before re-entering.
These simple visual cues make reading the Heikin Ashi candlestick pattern incredibly beginner-friendly.
A Simple Heikin Ashi Candle Strategy You Can Use Today
This trend-following setup pairs Heikin Ashi candles with moving averages for clarity and confirmation — a “sanity check” that helps avoid bad entries.
Indicators Needed
- Heikin Ashi candlesticks
- 10 EMA (fast moving average)
- 50 EMA (slow moving average)
The Buy Rule
- Price crosses above both EMAs.
- Wait for the first green Heikin Ashi candle.
- Crucial: The candle must have no lower wick.
- Enter at the close.
This confirms trend strength + momentum + technical alignment.
The Sell Rule
- Price crosses below both EMAs.
- Wait for the first red Heikin Ashi candle.
- Crucial: The candle must have no upper wick.
- Enter at the close.
This avoids premature exits and helps you catch major downtrends.
Exit Strategy
Stay in the trade until:
- The candle color flips, OR
- You see small-bodied doji-like candles
Never guess the top or bottom — let the chart tell you.
The Strengths & Weaknesses of Heikin Ashi Candlesticks
✔ The Good Stuff
1. Removes Emotional Panic
No more random red or green flashes that scare you out of trades.
2. Makes Trend Identification Easy
Even beginners can clearly see whether buyers or sellers are in control.
3. Encourages Discipline
Heikin Ashi naturally forces you to stay in trades longer — catching bigger moves.
✖ The Catch (Important to Know)
1. It Lags
Because it averages price, it reacts slower than real-time candlesticks. You won't catch exact tops or bottoms — but you will catch the stronger middle trend.
2. The Price Is Not Real Price
Heikin Ashi values are synthetic. Never place limit orders based on them. Always check actual market price / LTP before placing trades.
The Bottom Line: Why Heikin Ashi Helps You Trade Calmer and Smarter
Heikin Ashi won’t magically turn anyone into a millionaire trader. But it will help you:
- Cut through market noise
- Avoid emotional exits
- See trends clearly
- Ride trades longer
- Stay focused rather than reactive
Sometimes the best trading move is to simply do nothing — and Heikin Ashi helps you stay disciplined enough to hold steady when the market looks chaotic.
Most trading platforms let you turn on Heikin Ashi candlesticks with a single click. Try it. You’ll be amazed at how much calmer the market looks when you filter out unnecessary noise.
FAQs
1. Can I use Heikin Ashi for day trading?
Yes, but be cautious.On very fast timeframes (like the 1-minute chart), the lag effect becomes more noticeable.Heikin Ashi works best on 5-minute, 15-minute, 1-hour, or daily charts, where trends last longer.
2. Why doesn’t the Heikin Ashi price match the real market price?
Because the Heikin Ashi formula uses averages, not raw OHLC values. Always refer to the actual LTP (Last Traded Price) before placing any trade.
3. Does Heikin Ashi show price gaps?
No. The calculation smooths out gaps completely. If your strategy depends on gap trading, switch back to traditional candles.
4. What indicators work well with Heikin Ashi?
Momentum indicators pair perfectly with Heikin Ashi, such as:
- RSI for spotting exhaustion
- ADX for identifying true trend strength
- EMAs for alignment and confirmation
5. Is Heikin Ashi better than Renko?
Not better — just different.
- Renko removes time entirely.
- Heikin Ashi respects time but smooths price. For beginners, Heikin Ashi feels more natural because it still resembles normal candlesticks.
Disclaimer
Educational Only This article is for educational purposes only. Nothing here is legal, financial, or investment advice. Examples are for illustration, not recommendations.
Risk Warning Trading involves risk. Market regulations may change. Always consult a SEBI-registered financial advisor before taking action.