Post Market Analysis: Nifty Closing, Post Stock Market Review 20-1-2026

Post Market Pulse: The Day in Review 📊
The Indian equity market witnessed a brutal sell-off today, extending losses for the second consecutive session. The bears tightened their grip as the Nifty 50 crashed over 350 points, slipping well below the psychological 25,250 mark. A broad-based decline was triggered by renewed global trade tensions, persistent FII outflows, and a sharp slide in the rupee, which breached the 91 per USD mark.
Index Performance Snapshot
A quick review of the major indices shows the market momentum for the day.
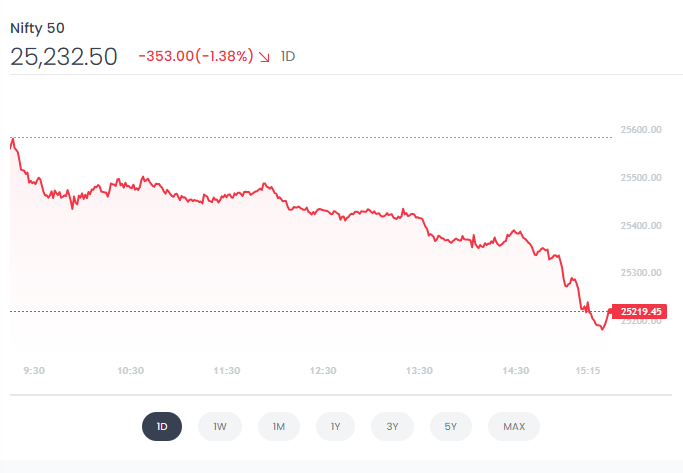
1. Nifty 50
25,232.50 | -353.00 (-1.38%)
Intraday Analysis: The market opened with a negative bias and saw a "waterfall" decline throughout the session. Unlike yesterday, there was no mid-day recovery. The Nifty broke key support levels at 25,500 and 25,300 effortlessly, hitting an intraday low of 25,171.35 before a marginal adjustment at closing. The "Sell on Rise" texture has aggressively shifted to "Sell into Weakness."
Top Gainers (Nifty 50)
These stocks led the charge, delivering the highest returns this day.
Top Losers (Nifty 50)
The following stocks faced selling pressure and registered the day's biggest declines.
F&O Corner
OI Analysis

Near Resistance for the Week: 25,400 The 25,400 strike has accumulated the highest Call Open Interest, cementing it as the new "Iron Ceiling" for the week. This significant Call writing suggests bears are aggressively defending this level, and bulls would need a significant catalyst to cross it.
Near Support for the Week: 25,200 The 25,200 strike currently holds the highest massive Put writing cluster, acting as the primary support or "Floor." As long as this level holds, the market may attempt to consolidate, but a break below could trigger a slide toward lower levels like 25,000.
Put Call Ratio (PCR) Present Ratio: 0.65 | Current Scenario: BEARISH 0.65 | Scenario: BEARISH
The PCR is at 0.65, with Total Call OI (19.09 Cr) significantly outpacing Total Put OI (12.77 Cr). This indicates aggressive Call writing. While this suggests the market is technically oversold, the sentiment remains bearish unless the ratio improves.
Max Pain Analysis
25,350
The Max Pain level is positioned at 25,350, which acts as a magnet for the expiration. With the market trading near support levels, any move towards 25,350 would relieve pressure on option writers, whereas sustained trading below this level traps Put writers, potentially increasing volatility.
Volatility Index (India VIX)
India VIX: 12.73 | ▲ +0.9025 (+7.63%)
The Fear Gauge spiked over 7% to settle at 12.73. This sharp expansion in Implied Volatility (IV) confirms that market participants are aggressively buying options, signaling an expectation of increased turbulence and wider price swings in the near term.
Major News & Key Events
- Global Gloom: Sentiment was hammered by US President Donald Trump's threat of new tariffs on European nations, reigniting trade war fears. This triggered a sell-off across Asian and European markets.
- Currency Woes: The Indian Rupee (INR) weakened past the 91/USD mark for the first time, ending at 90.98, pressured by intense FII selling.
- Sectoral Stress: All sectoral indices closed in the red. Nifty Metal and Nifty Realty were the worst performers, cracking over 2% each.
- Earnings Impact: Wipro continued to drag (down ~8% yesterday, weak today) after its muted guidance, while ICICI Bank remained under pressure following its profit dip reported yesterday.
Indian Stock Market Today Graph – What the Intraday Chart Shows
From the Indian stock market today graph, three important signals stand out:
- Continuous lower lows throughout the session
- No intraday pullback or short covering
- Breakdown of multiple support levels in one move
This pattern typically appears during panic-driven distribution and confirms strong bearish control.
Intraday Market Interpretation – Smart Money View
Trading Strategy for the Next Session (Educational)
For Intraday Traders:
- Sell on pullbacks below 25,300
- Strict stop-loss due to high volatility
For Option Buyers:
- Rising IV supports directional option trades
For Positional Traders:
- Avoid bottom fishing until volatility cools
For Investors:
- Do not panic; corrections are part of bull markets
- Focus only on high-quality stocks near strong supports
Final Thoughts – Post Market Today Outlook
This post market today report clearly confirms that the market is in a high-volatility corrective phase. With broken supports, rising VIX, weak currency, and heavy derivatives pressure, caution is warranted.
Short-term traders must prioritize risk management, while investors should avoid emotional decisions and wait for stability.
FAQs
1. Why did the Indian stock market fall today?
The Indian stock market fell today due to renewed global trade war fears, heavy FII outflows, sharp depreciation in the rupee beyond 91/USD, and broad-based sectoral selling.
2. How much did Nifty 50 fall today?
Nifty 50 fell by 353 points or 1.38% and closed at 25,232.50, breaking multiple key support levels during the session.
3. What does a waterfall decline mean in intraday trading?
A waterfall decline refers to a continuous sharp fall without meaningful pullbacks, indicating strong institutional selling and absence of dip-buying.
4. Is today’s fall a sign of a market crash?
No, today’s fall reflects a short-term panic-driven sell-off. It is a correction within a broader trend, not a confirmed market crash.
5. What is the significance of 25,200 support?
25,200 is the highest Put OI zone and acts as the primary support. A break below this level can open the door for a move towards 25,000.
6. Why is India VIX rising important?
A rising India VIX indicates increasing fear and higher option premiums, signaling wider price swings and higher trading risk.
7. What does PCR of 0.65 indicate today?
A PCR of 0.65 indicates aggressive Call writing and bearish sentiment, even though the market may be technically oversold.
8. What should traders watch tomorrow?
Traders should watch:
- 25,200 as immediate support
- 25,400 as major resistance
- Rupee movement
- Global cues and trade war developments
Disclaimer:This report is for informational and educational purposes only and does not constitute financial advice. Please consult a registered financial advisor before making any trading or investment decisions.
Happy Trading 📊
— The Firstock Team