Indian Stock Market Today: Nifty Closing, Post Stock Market Review 16-2-2026

Post Market Pulse: The indian stock market today
Date: February 16, 2026
The Nifty 50 staged a strong recovery, snapping its two-day losing streak to close at 25,682.75 (+0.83%). After a weak opening that saw the index slip below the 25,400 mark due to mixed global cues, intense buying interest in the second half propelled the index toward its intraday high. The market successfully reclaimed the 25,650 level, forming a bullish engulfing candle on the daily charts. India VIX remained relatively flat, settling at 13.33 (+0.28%), suggesting that while volatility remains higher than last week's lows, the panic from the recent IT sell-off has begun to subside.
Index Performance Snapshot
Nifty 50
25,682.75 | +211.65 (+0.83%)
Intraday Analysis: The market opened at 25,423.60, reflecting early morning weakness. The index hit an intraday low of 25,372.70 shortly after the open as bears initially dominated. However, the tide turned by midday, with the index witnessing a steady climb to an intraday high of 25,697.00. A strong closing near the day's high indicates robust bullish momentum heading into the next session.
Top Gainers (Nifty 50)
Top Losers (Nifty 50)
F&O Corner
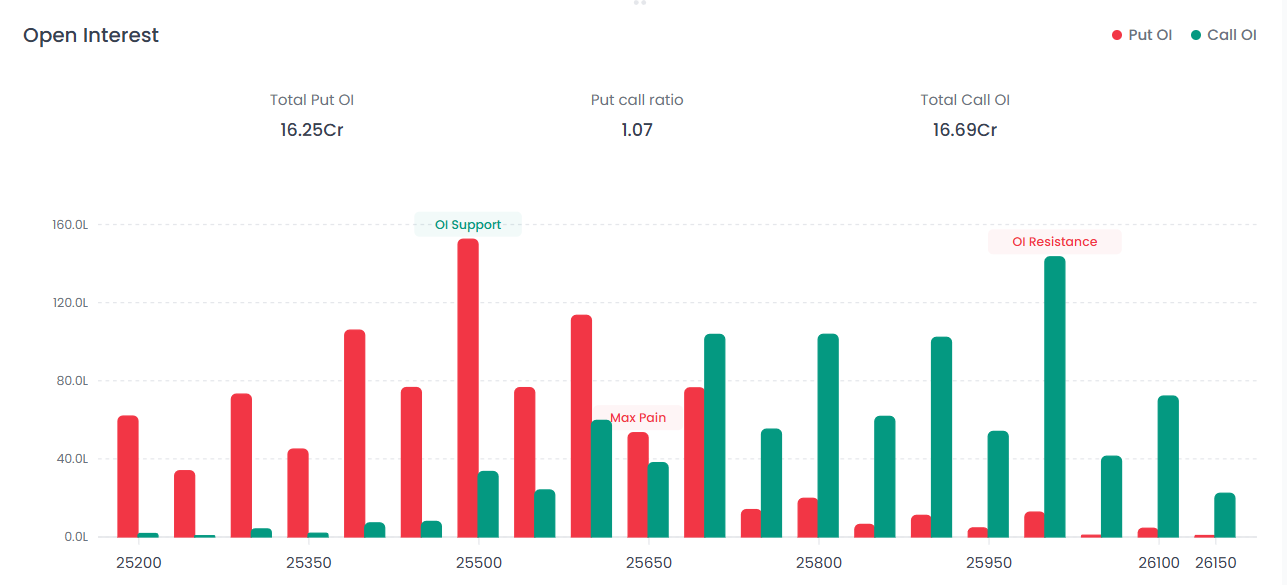
OI Analysis
Near Resistance: 26,000 The 26,000 strike continues to be the primary hurdle for the bulls, with Total Call OI standing at 16.69 Cr. Significant resistance is also noted at the 25,950 level.
Near Support: 25,500 The 25,500 strike has emerged as the strongest immediate base with the highest Put concentration. Total Put OI stands at 16.25 Cr.
PCR Analysis: 1.07 The Put-Call Ratio (PCR) has improved significantly to 1.07, moving from a bearish zone to a more balanced/neutral sentiment, reflecting fresh put writing at lower levels.
Max Pain
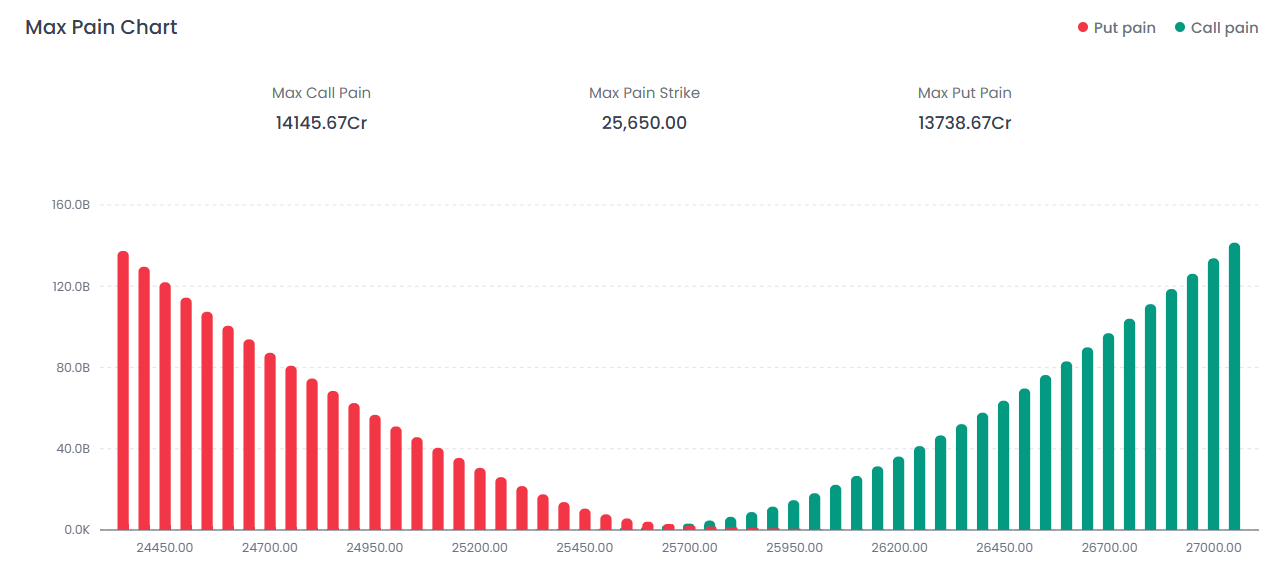
The Max Pain Strike is currently pegged at 25,650.00. With the market closing at 25,682.75, the index is positioned just above this level, suggesting that option sellers are currently most comfortable with the index hovering around this zone.
India VIX
Current Level: 13.33 | +0.0375 (+0.28%)
Interpretation: The "Fear Gauge" was largely stable today. Despite the sharp intraday recovery, the VIX didn't cool down significantly.
Major Market Drivers
Banking & Power Lead Rebound: Heavyweights like HDFC Bank and Power Grid provided the necessary muscle for the recovery. Buying in PSU Banks further supported the sentiment as the sector saw a broad-based rally.
IT Sector Stabilizing: While IT stocks like Tech Mahindra remained in the red, the intensity of the "AI-led meltdown" seen last week slowed down. Investors are now awaiting cues from the ongoing Global AI Impact Summit.
WPI Inflation Data: Wholesale inflation accelerated to 1.81% in January. While higher than the previous month, the market appeared to have largely priced in the uptick, focusing instead on the decline in US 10-year yields.
Indian Stock Market Today – Technical Summary
Final Outlook – Indian Stock Market Today
The Indian stock market today reflects a decisive recovery after last week's IT-led weakness. The formation of a bullish engulfing candle and the improvement in PCR to 1.07 signal strengthening sentiment in the derivatives space.
However, the 26,000 level remains the key psychological resistance. A decisive breakout above this mark could open the path toward fresh highs, while failure to sustain above 25,650 may result in short-term consolidation between 25,500–26,000.
FAQs
1. How did the Indian stock market today perform?
The Nifty 50 closed higher by 0.83% at 25,682.75, snapping a two-day losing streak.
2. What drove the recovery in the Indian stock market today?
Strong buying in Banking and Power stocks, along with stabilization in the IT sector, fueled the rebound.
3. What does PCR of 1.07 indicate today?
A PCR above 1 suggests improving sentiment, indicating balanced to slightly bullish positioning in the options market.
4. Is volatility still high in the Indian stock market today?
India VIX remains above 13, showing moderate volatility but not panic levels.
5. What is the key level to watch next?
The 26,000 resistance and 25,500 support are the critical levels for the upcoming session.
Disclaimer: This report is for informational purposes only and does not constitute financial advice. Please consult your financial advisor before making any investment decisions.
Happy Trading! The Firstock Team