Indian Stock Market Today: Nifty Closing, Post Stock Market Review 17-2-2026

Post Market Pulse: The indian stock market today 📊
Date: February 17, 2026
The Nifty 50 extended its winning streak for a second consecutive session, as the market transitioned into a phase of steady, controlled recovery. Despite opening lower due to a widening trade deficit and negative global cues, aggressive bottom-fishing in index heavyweights particularly within the IT and Banking sectors—propelled the index into positive territory. This resilience suggests a shift in sentiment from "panic-selling" to "selective accumulation," as investors stabilized their outlook following recent volatility.
Index Performance Snapshot
Nifty 50
25,725.40 | +42.65 (+0.17%)
Intraday Analysis: The index hit an intraday low of 25,570.30 shortly after the open as bears initially dominated. However, the tide turned by midday, with the index witnessing a steady climb to an intraday high of 25,764.40. A strong closing near the day's high indicates robust bullish momentum heading into the next session.
Top Gainers (Nifty 50)
Top Losers (Nifty 50)
F&O Corner
OI Analysis
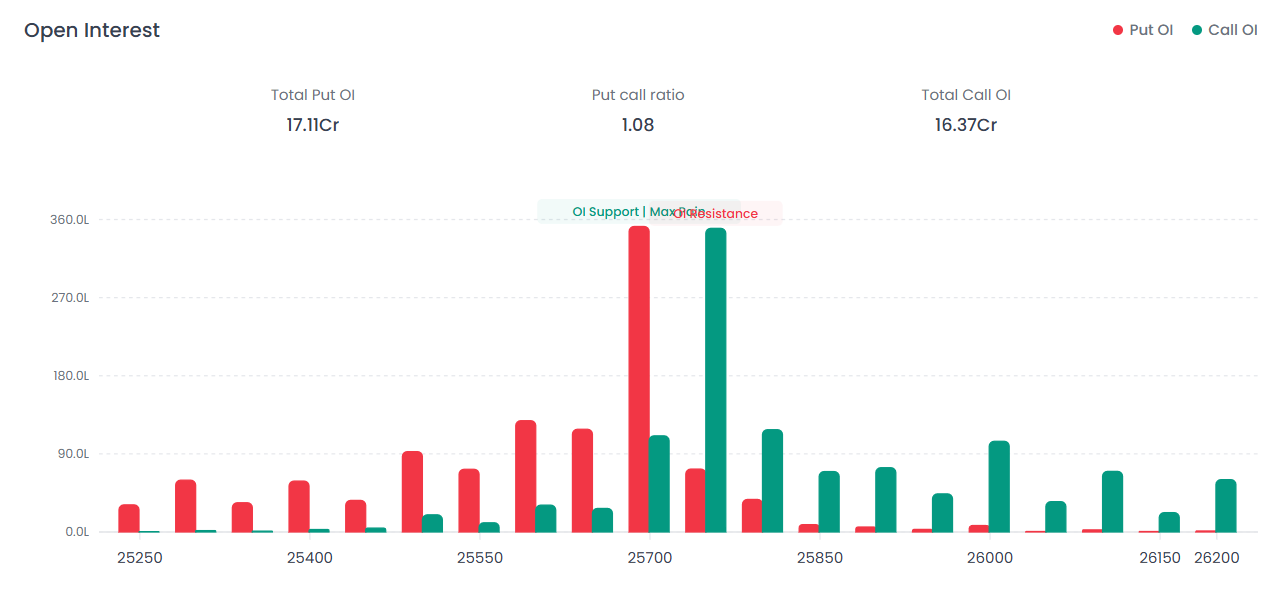
Near Resistance: 25,750 The 25,750 strike has emerged as a significant hurdle for the bulls, with substantial Call OI concentration. A further ceiling is visible at the 26,000 mark, where Total Call OI stands at 16.37 Cr.
Near Support: 25,700 The 25,700 strike has become the immediate battleground and strongest base with the highest Put concentration. Total Put OI for the session stands at 17.11 Cr.
PCR Analysis: 1.08 The Put-Call Ratio (PCR) stands at 1.08, reflecting a slightly bullish to neutral sentiment. The fact that Put OI slightly outweighs Call OI suggests that traders are writing puts, expecting the 25,700 level to hold.
Max Pain
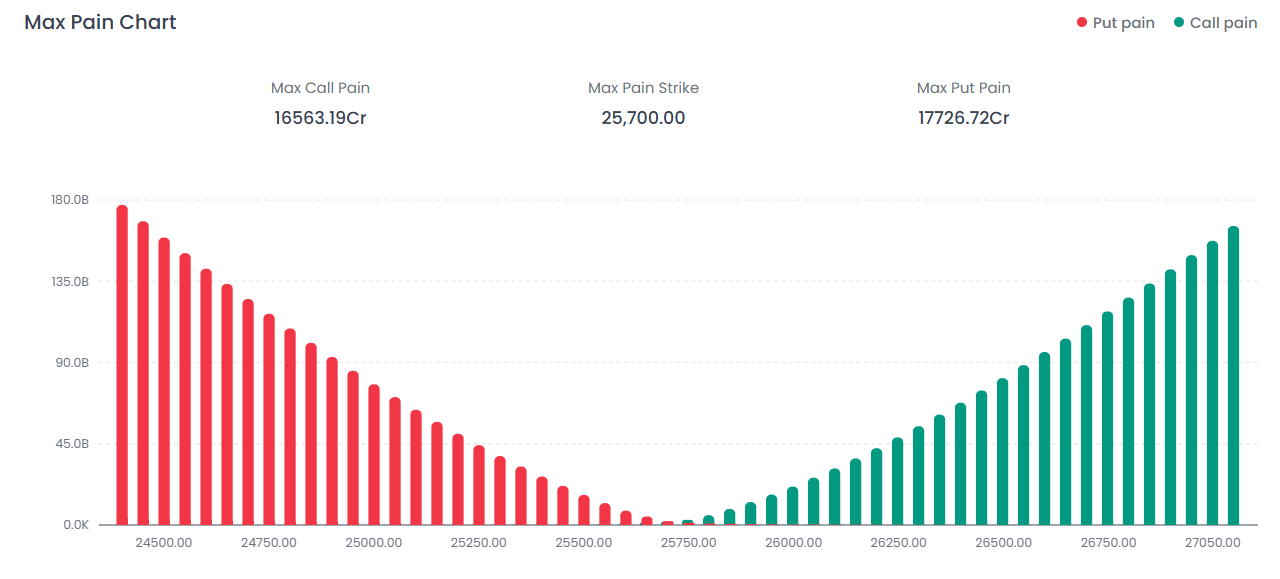
The Max Pain Strike is currently pegged at 25,700.00. With the market closing at 25,725.40, the index is perfectly aligned with the zone where option writers stand to lose the least, indicating a highly efficient expiration setup around this psychological handle.
India VIX
Current Level: 12.67 | -0.65 (-4.93%)
Interpretation: The "Fear Gauge" cooled down significantly today, dropping nearly 5%. This contraction in volatility suggests that the recent anxiety is fading, and market participants are becoming more comfortable with the current price levels, despite the lack of a massive breakout.
Major Market Drivers
Adani and ITC Lead: Strength in Adani Enterprises and a defensive move into ITC provided the primary support for the index today. The heavy-weight support helped offset the drag from the Metal sector.
IT Rebound Contributes: Infosys saw a decent recovery of 1.87%, signaling that the recent IT sector carnage is finding a floor as institutional investors bottom-fish in quality tech names.
Metal Sector Drag: Hindalco and Tata Steel faced selling pressure, likely due to fluctuating global commodity prices and cooling demand forecasts, acting as the main weight on the Nifty's upward trajectory.
Indian Stock Market Today – Technical Summary
Final Outlook – Indian Stock Market Today
The Indian stock market today reflects controlled accumulation after last week's volatility spike. The alignment of price near the Max Pain level (25,700) combined with a PCR above 1 suggests improving derivatives sentiment.
However, the 25,750–26,000 zone remains the decisive breakout region. A sustained move above 25,750 could open momentum toward 26,000, while failure to hold 25,700 may push the index back toward 25,500.
FAQs
1. How did the Indian stock market today perform?
The Nifty 50 closed at 25,725.40, gaining 0.17% and extending its recovery for the second straight session.
2. What drove the recovery in the Indian stock market today?
Buying in Adani Enterprises, ITC, and Infosys helped offset weakness in metals and supported the index.
3. What does a PCR of 1.08 indicate?
A PCR above 1 suggests that put writers are active, indicating a slightly bullish or neutral sentiment in the options market.
4. Is volatility decreasing in the Indian stock market today?
Yes, India VIX dropped nearly 5%, signaling easing anxiety and improving stability.
5. What level should traders watch next?
The immediate resistance lies at 25,750, followed by the psychological 26,000 level.
Disclaimer: This report is for informational purposes only and does not constitute financial advice. Please consult your financial advisor before making any investment decisions.
Happy Trading! The Firstock Team