Post Market Analysis: Nifty Closing, Post Stock Market Review 19-1-2026

Post Market Pulse: The Day in Review
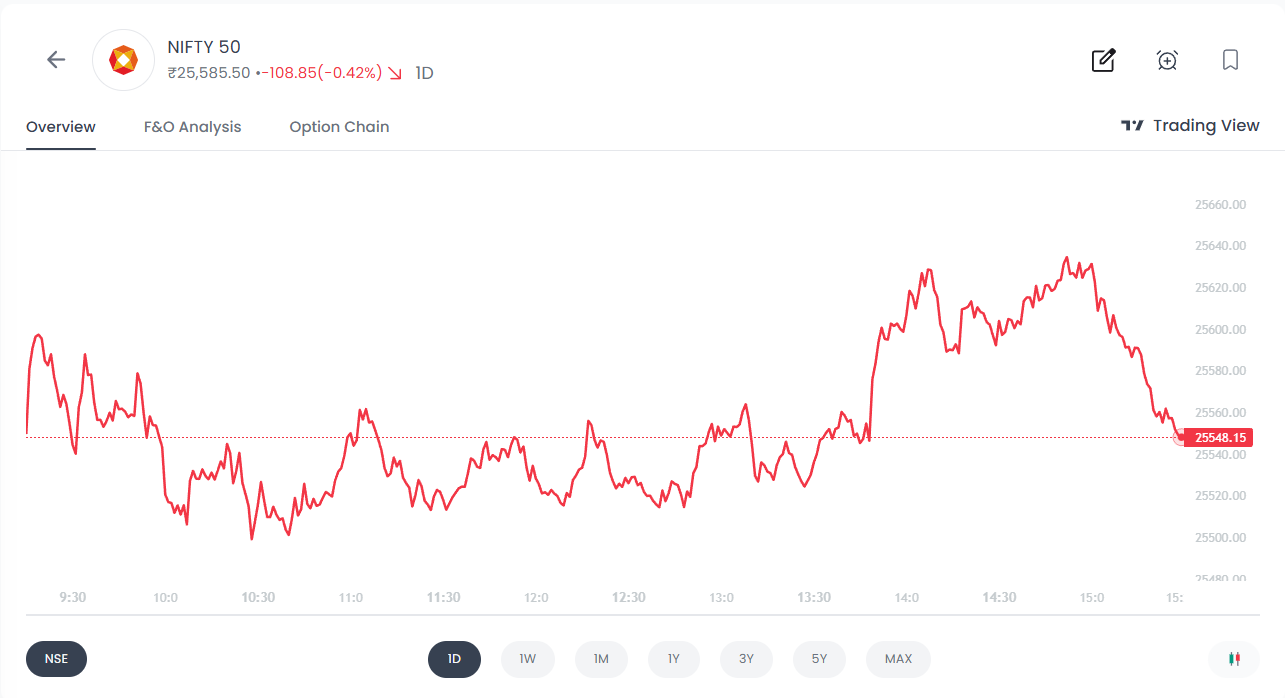
The Indian equity market witnessed a volatile and corrective session, with frontline indices succumbing to selling pressure after a failed recovery attempt. Nifty 50 closed with a loss of 0.42%, signaling weakness as higher levels attracted fresh selling. This decisive negative close suggests that the bears have tightened their grip, negating the mid-day recovery efforts.
Index Performance Snapshot
A quick review of the major indices shows the market momentum for the day.
1. Nifty 50
25,585.5 | -108.85 (-0.42%)
Intraday Analysis: The index opened with volatility and witnessed an initial dip, followed by a choppy consolidation phase during the mid-day session. In the afternoon, bulls attempted a strong recovery, driving a sharp vertical rally that temporarily reclaimed lost ground. However, this upside momentum was met with aggressive selling pressure in the final hour. The index faced a steep rejection from the day's highs, erasing all recovery gains to close deep in the red, indicating that "sell on rise" remains the dominant market texture.
Top Gainers (Nifty 50)
These stocks led the charge, delivering the highest returns this day.
Top Losers (Nifty 50)
The following stocks faced selling pressure and registered the day's biggest declines.
F&O Corner – OI Analysis
Understanding Open Interest (OI) helps gauge market sentiment and potential price movements for the next expiry.
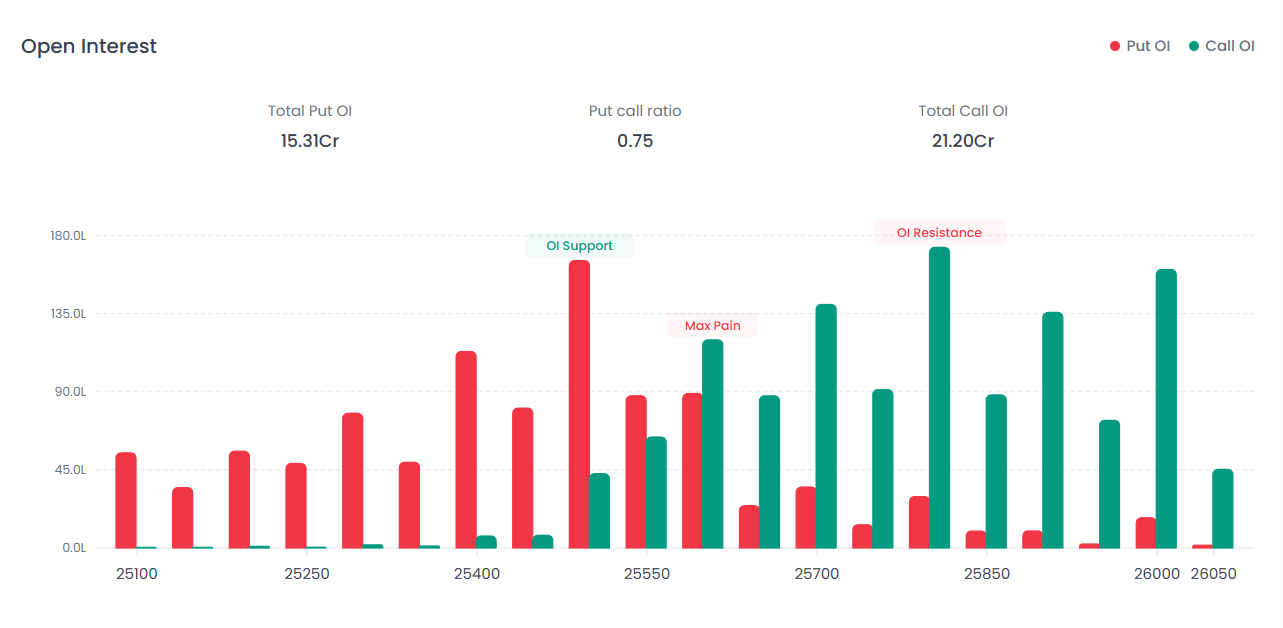
Near Resistance for the Week: 25,800 The chart flags this level as "OI Resistance." Significant Call writing is visible here (tall green bar), creating a massive "Ceiling." This indicates that traders do not expect the market to cross this zone easily in the immediate term.
Near Support for the Week: 25,500 The highest Put OI is observed at this strike, indicated by the tall red bar flagged as "OI Support." This serves as the primary "Floor" or safety net where buyers are likely to step in to defend the level.
Put Call Ratio (PCR)
Present Ratio: 0.75 | Current Scenario: BEARISH
A PCR below 1.0 indicates aggressive Call writing. While slightly higher than extreme lows, this ratio suggests the market sentiment remains skewed towards "Sell on Rise," with bears currently controlling the trend and capping the upside.
Interpretation
The market continues to exhibit bearish sentiment, evidenced by the Total Call OI (21.20 Cr) significantly outpacing the Total Put OI (15.31 Cr). The index is facing immediate pressure, leading up to a stiff resistance wall at 25,800. On the downside, the first major line of defense for the bulls remains at 25,500. The PCR of 0.75 confirms that Call writers remain confident, suggesting that any upside momentum is likely to be met with fresh selling unless the resistance at 25,800 is decisively broken.
Max Pain Analysis
Interpretation: The Max Pain level is currently positioned at 25,600.
The "Magnet" Effect: This level serves as the theoretical "sweet spot" for Option Writers (smart money). As expiry approaches, the market often gravitates toward this price to inflict the least amount of cumulative loss on option sellers. Currently, this suggests the market may attempt to consolidate or pull toward the 25,600 zone.
Volatility Index (India VIX)
The 'Fear Index' reflects the market's expectation of volatility.
India VIX: 11.8275 | +0.4550 (+4.00%)
Interpretation: The India VIX has registered a noticeable uptick, climbing to 11.83 with a gain of +4.00%. While the absolute value remains relatively low compared to historical extremes, this rise signals a departure from deep complacency and a renewed demand for hedging. This expansion in volatility contributes to a rise in option premiums (Vega expansion).
Major News & Upcoming Events
Major News of the Day
- Earnings Impact: ICICI Bank's net profit declined ~4% YoY, impacted by higher provisions for agricultural loans. Meanwhile, Reliance Industries reported a net profit of ₹18,645 crore, missing growth expectations.
- Global Cues: Asian markets closed mixed, while US markets are closed today for Martin Luther King Jr. Day.
- Geopolitics: Trade tensions have resurfaced after the US administration threatened 10% tariffs on several European countries, adding to global uncertainty.
Post Market Analysis – What Today’s Closing Tells Us
This post market analysis highlights three critical aspects of today’s session:
- Failure of Recovery Attempts – Afternoon rally was fully sold into
- Strong Supply at Higher Levels – Confirms sell-on-rise structure
- Rising Volatility with Falling Price – Early warning of trend continuation
The post stock market structure clearly favors bearish control in the near term.
Post Stock Market Structure – At a Glance
Final Post Market Outlook
This post market analysis confirms that the post stock market structure remains firmly under bearish control. Failed recovery attempts, heavy Call writing, and rising volatility suggest that sell-on-rise remains the preferred strategy until a decisive breakout above 25,800 occurs.
FAQs
1. What is post market analysis?
Post market analysis is the study of stock market movement after the market closes, focusing on price action, intraday structure, derivatives data, and news to understand the next day’s trading bias.
2. How did the Indian stock market close today?
The Indian stock market closed in the red today, with Nifty 50 declining 0.42% after failing to sustain an afternoon recovery.
3. What does today’s post stock market data indicate?
Today’s post stock market data indicates a bearish structure, with strong selling at higher levels and aggressive Call writing near resistance.
4. Is the post market trend bearish or neutral?
The short-term post market trend is bearish, supported by intraday rejection, low PCR, and rising volatility.
5. What are the key levels to watch tomorrow?
Immediate resistance is near 25,800, while strong support lies at 25,500.
6. Why is India VIX rising in a falling market?
A rising VIX in a falling market indicates increasing fear and higher demand for hedging, often preceding sharper moves.
Disclaimer: This report is for informational purposes only and does not constitute financial advice. Please consult your financial advisor before making any investment or trading decisions.
Happy Trading 📊 — The Firstock Team