Post Market Analysis: Nifty Closing, Post Stock Market Review 21-1-2026

Post Market Pulse: The Day in Review 📊
The Indian equity market remained under pressure, but today’s session told a slightly different story compared to the recent sell-off. While the bears dominated early trade, aggressive buying at lower levels helped limit the damage, signaling emerging support near key psychological levels.
Index Performance Snapshot
A quick review of the major indices shows the market momentum for the day.
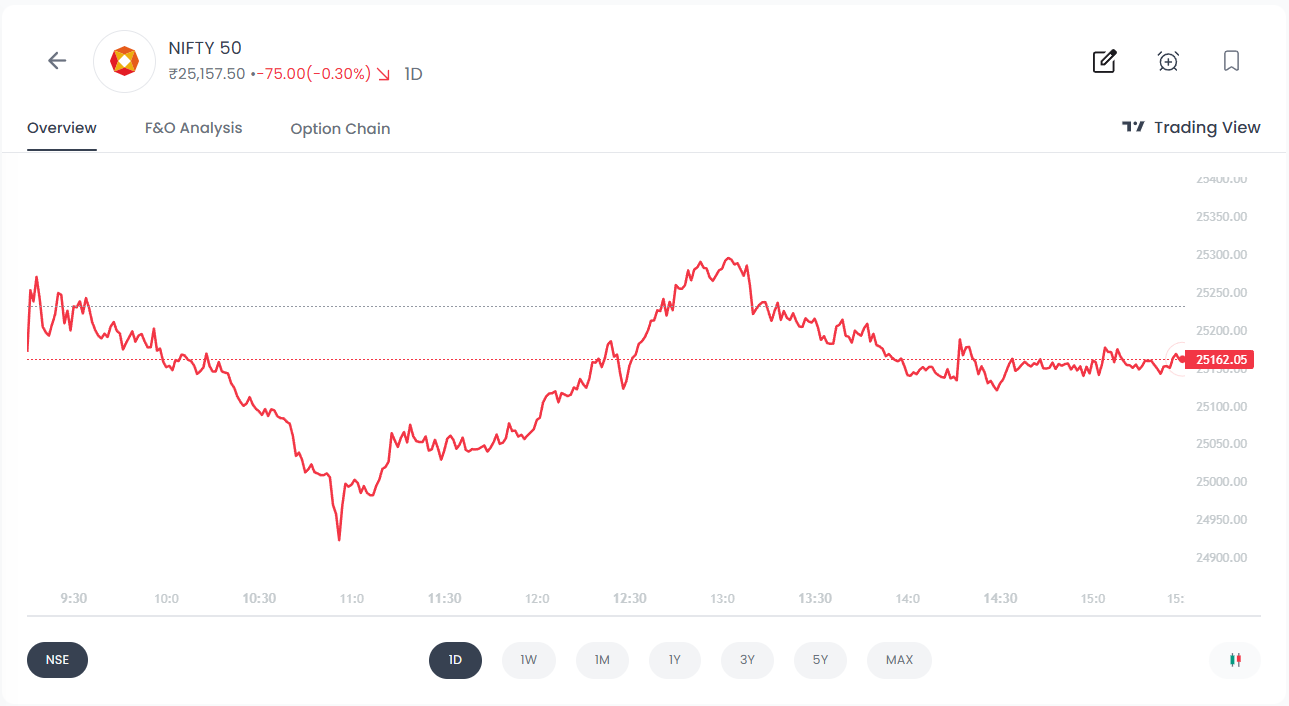
1. Nifty 50
25,157.5 | -75.00 (-0.3%)
Intraday Analysis: The market opened with volatility and saw a sharp "waterfall" decline during the morning session. Unlike the previous reading which suggested no recovery, today witnessed a significant V-shaped recovery from the lows. The Nifty briefly breached the psychological support of 25,000, hitting an intraday low near 24,919, before bulls aggressively defended this zone. The index rebounded by nearly 200 points from the bottom to settle near 25,157. The market texture has shifted from a one-way "Sell into Weakness" to "Volatile with Buying at Lows," indicating that while pressure persists, the 25,000 level is acting as a hard floor.
Top Gainers (Nifty 50)
These stocks led the charge, delivering the highest returns this day.
Top Losers (Nifty 50)
The following stocks faced selling pressure and registered the day's biggest declines.
F&O Corner
OI Analysis
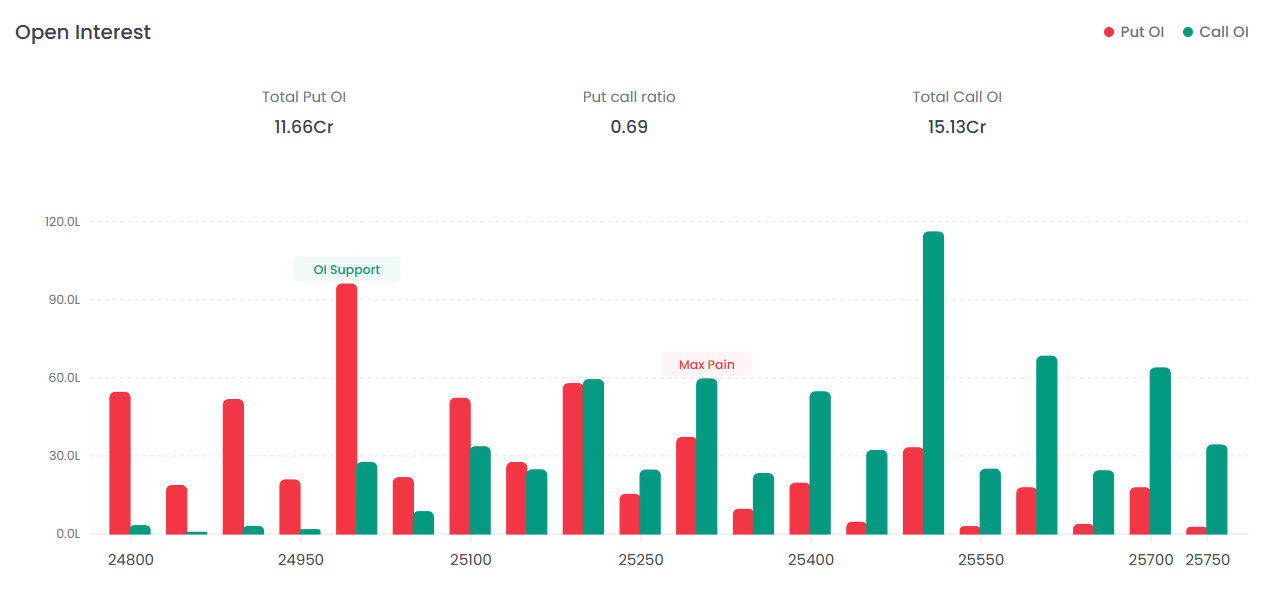
Near Resistance for the Week: 25,500 The resistance level has shifted higher to 25,500 (previously 25,400), which now holds the highest Call Open Interest. This visible "Iron Ceiling" suggests that while the immediate cap has moved up, Call writers have built a massive fortress at this level, making it extremely difficult for bulls to breach without significant momentum.
Near Support for the Week: 25,000 Significant weakness is visible as the primary support has slid from 25,200 down to 25,000 (marked as "OI Support"). This strike now holds the highest concentration of Put writing. The shift in the "Floor" by 200 points lower confirms that bears have successfully pushed the market's safety net downwards. A breach of this 25,000 psychological level could trigger aggressive selling.
Put Call Ratio (PCR) Present Ratio: 0.69 | Current Scenario: BEARISH
The PCR has seen a marginal uptick to 0.69 from the previous reading of 0.65. However, with Total Call OI (15.13 Cr) still significantly outpacing Total Put OI (11.66 Cr), the sentiment remains firmly bearish. The slight rise in PCR suggests minor profit-booking by bears, but the overall structure indicates that Call writers maintain control.
Max Pain Analysis
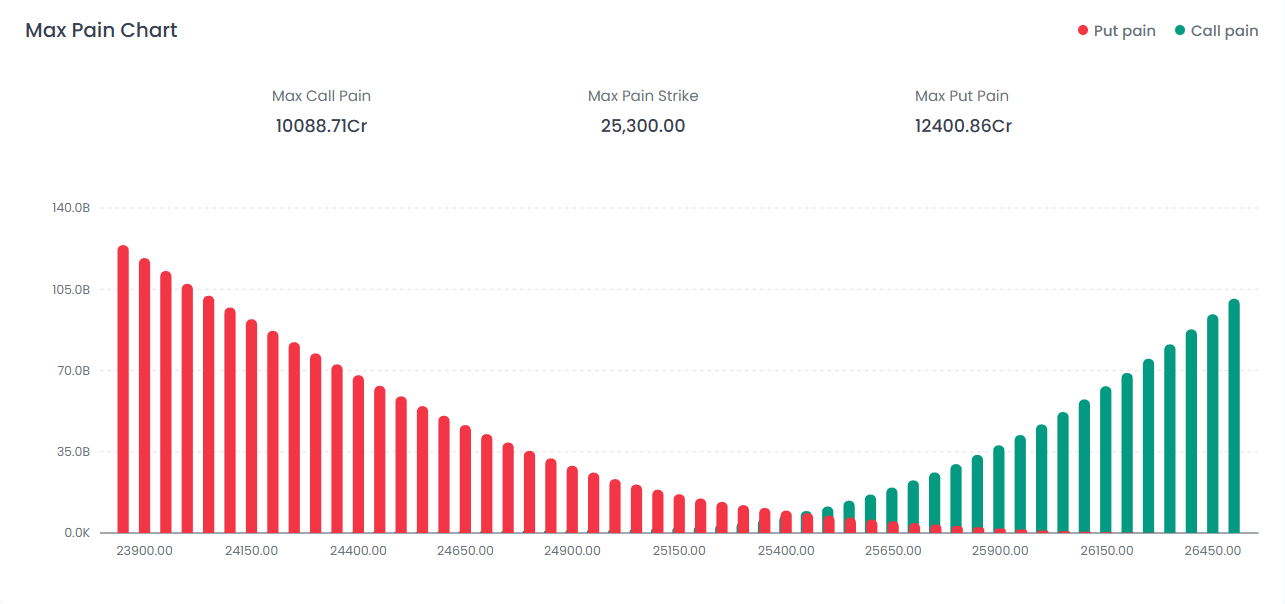
25,300
The Max Pain strike stands firm at 25,300, significantly higher than the current market price (~25,157). The data reveals that Max Put Pain (12,400.86 Cr) noticeably outweighs Max Call Pain (10,088.71 Cr), indicating that Put writers are currently trapped and under stress. This divergence creates a strong "magnetic pull," suggesting the market may attempt a relief rally toward 25,300 to minimize losses for option sellers, despite the prevailing bearish sentiment.
Volatility Index (India VIX)
India VIX: 13.78 | ▲ +1.05 (+8.25%)
The Fear Gauge spiked over 8.25% to settle at 13.78, rising sharply from the previous close of 12.73. This significant expansion in Implied Volatility (IV) from the prior session confirms that market participants are aggressively buying options, signaling a growing expectation of increased turbulence and wider price swings in the near term.
Major News & Key Events
- Earnings Impact: Shoppers Stop plunged over 6% after reporting a sharp drop in Q3 net profit, dampening sentiment in the retail sector. Hindustan Zinc, conversely, rallied on strong results.
- Global Cues: US markets closed sharply lower overnight (Nasdaq down ~2.4%), and European indices opened in the red today, weighing on Indian IT and banking stocks.
- Rupee Pressure: The INR hit a new record low of 91.60 against the dollar intraday before settling near 91.54, driven by continued foreign fund outflows.
- Sectoral Divergence: While Nifty Metal and New Age stocks gained, Bank Nifty was the worst performer (-1.02%) due to selling in private banks like ICICI and HDFC.
Indian Stock Market Today Graph – What the Chart Reveals
From the Indian stock market today graph, three important developments stand out:
- Sharp early-session breakdown below 25,000
- Strong intraday V-shaped recovery
- Aggressive buying interest near psychological support
This pattern indicates the presence of institutional demand near 25,000, suggesting that this zone is emerging as a critical near-term reference level.
Intraday Market Interpretation – Smart Money Snapshot
Sectoral Performance Overview
Final Summary – Post Market Today
This post market today report highlights a session of high volatility with strong buying defense near the 25,000 zone. While bearish sentiment continues in derivatives and macro pressure remains from global cues and currency weakness, the intraday recovery suggests emerging stability at key psychological levels.
FAQs
1. How did the Indian stock market perform today?
The Indian stock market closed marginally lower today with Nifty 50 ending at 25,157.5, down 75 points or 0.3%, after witnessing a sharp intraday recovery from below the 25,000 level.
2. What does a V-shaped recovery indicate in intraday trading?
A V-shaped recovery indicates aggressive buying after a sharp fall, suggesting strong support at lower levels and active institutional participation.
3. Why is 25,000 an important level for Nifty today?
25,000 is a key psychological and OI-based support level. Heavy Put writing and strong buying interest indicate that this zone is acting as a short-term floor.
4. What is the current trend according to PCR and OI data?
With a PCR of 0.69 and higher Call Open Interest than Put Open Interest, the derivatives structure remains bearish despite intraday recovery.
5. What does rising India VIX signal today?
Rising India VIX signals increasing fear, higher option premiums, and expectations of wider price swings in the near term.
6. Why is the rupee weakness affecting the stock market?
A weakening rupee increases foreign fund outflows, raises import costs, and negatively impacts investor sentiment, especially in banking and IT stocks.
7. Which sectors showed relative strength today?
Nifty Metal and New Age stocks showed relative strength, while Bank Nifty remained the weakest sector due to selling in private banks.
8. Is today’s recovery a trend reversal?
Today’s recovery reflects buying support near 25,000 but does not yet confirm a trend reversal. Volatility and bearish derivatives positioning suggest continued caution.
Disclaimer: This report is for informational purposes only and does not constitute financial advice. Please consult your financial advisor before making any investment decisions.
Happy Trading! 📊
— The Firstock Team