Post Market Analysis: Nifty Closing, Post Stock Market Review 28-1-2026

Post Market Pulse: The Day in Review 📊
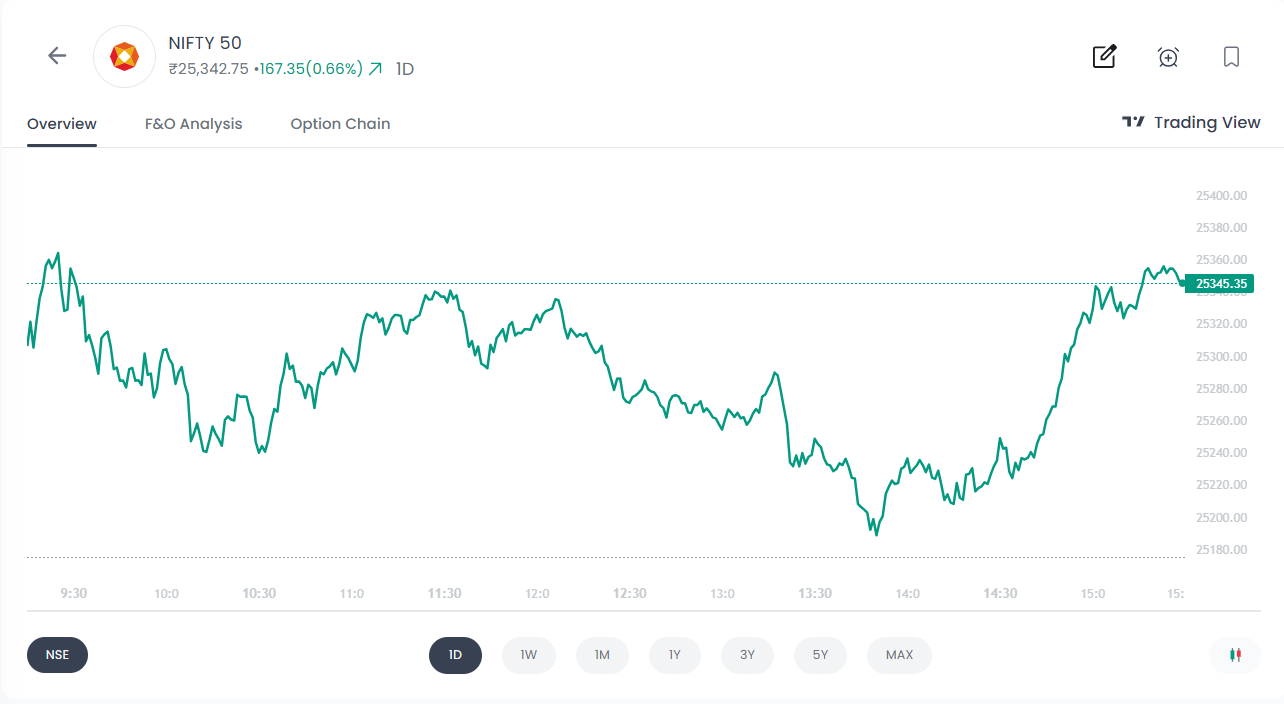
The Indian equity market staged a notable recovery today, extending its winning streak for a second consecutive session. The Nifty 50 finished firmly in the green, gaining 167.35 points (+0.66%) to settle at 25,342.75, successfully reclaiming and holding levels well above the 25,300 mark. This reversal was primarily driven by positive sentiment surrounding the conclusion of the "landmark" India-EU Free Trade Agreement negotiations.
Index Performance Snapshot
A quick review of the major indices shows the market momentum for the day.
1. Nifty 50
25,342.75 | +167.35 (+0.66%)
Intraday Analysis: The market opened with a volatile start, witnessing an initial surge followed by a steady decline through the morning. After reaching a daily low near 13:45, the Nifty demonstrated strong bullish momentum in the final hours. The index surged past intraday resistances to hit a high of approximately 25,372 before a minor cooling off at the close. The "Sell on Rise" sentiment seen in the mid-day session shifted toward a "Buy on Dips" behavior, ending the day on a positive note at 25,342.75.
Top Gainers (Nifty 50)
These stocks led the charge, delivering the highest returns this day.
Top Losers (Nifty 50)
The following stocks faced selling pressure and registered the day's biggest declines.
F&O Corner
OI Analysis
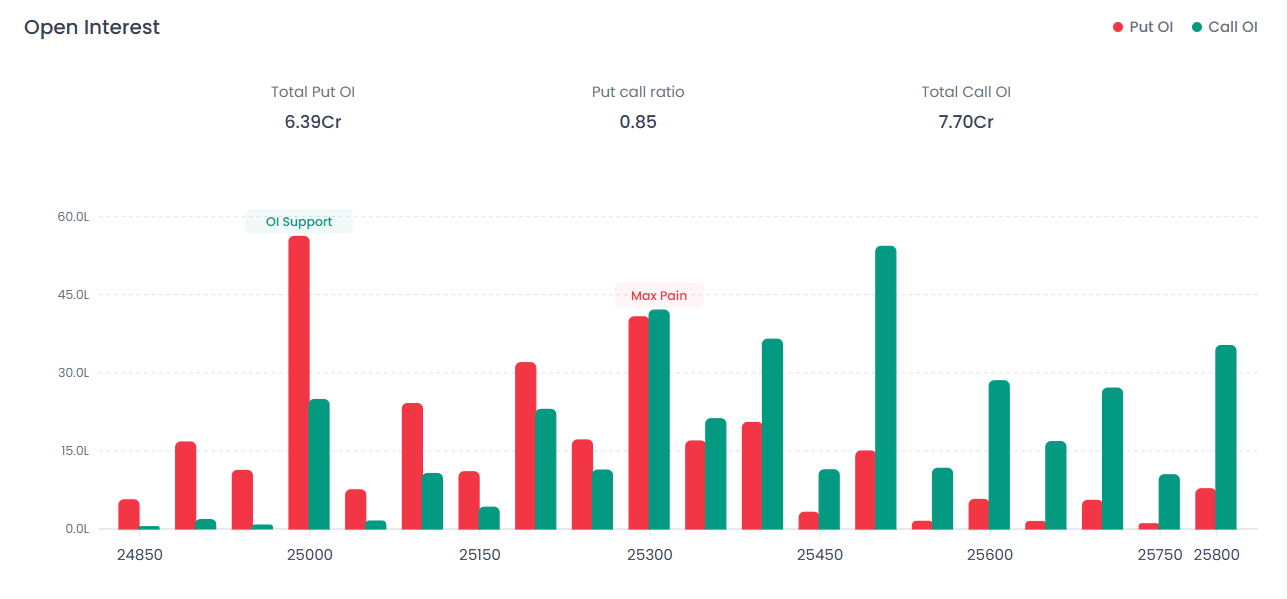
- Near Resistance: 25,500. The 25,500 strike has accumulated the highest Call Open Interest (as shown by the prominent green bar), cementing it as the new "Iron Ceiling" for the week. This significant Call writing suggests bears are aggressively defending this level.
- Near Support: 25,000. The 25,000 strike currently holds the highest massive Put writing cluster (the tallest red bar), acting as the primary support or "Floor". As long as this level holds, the market may attempt to consolidate.
PCR Analysis: 0.85
The PCR (Put Call Ratio) is at 0.85, with Total Call OI (7.70 Cr) outpacing Total Put OI (6.39 Cr). This indicates aggressive Call writing; while the ratio has ticked up from previous lows, the sentiment remains bearish as long as Call resistance remains heavy.
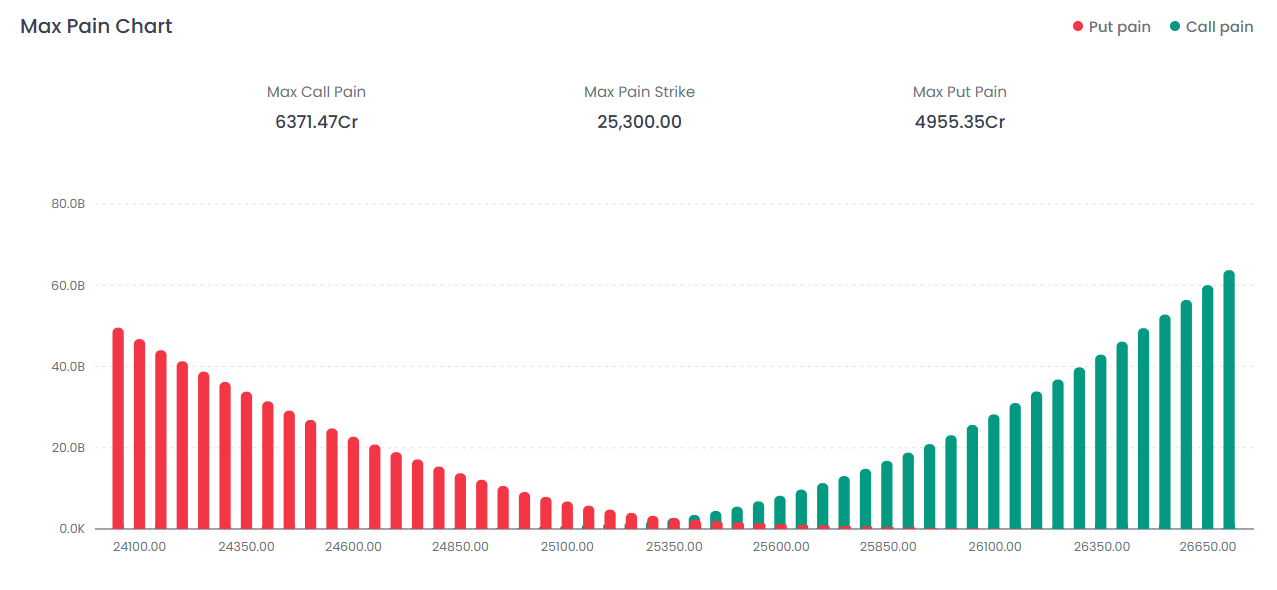
Max Pain
The Max Pain level is positioned at 25,300.00, representing the strike price where the most options (both calls and puts) would expire worthless. This level acts as a magnet for the expiration, as it is the point where option writers incur the least aggregate loss.
India VIX
Current Level: 13.52 | -0.92 (-6.42%)
Interpretation: The Fear Gauge settled at 13.52 after a sharp contraction. This indicates that market participants are seeing a significant reduction in fear, signaling a decrease in expected turbulence and more stable price action for the near term.
Major Market Events
The "Mother of All Deals": India-EU FTA Details
- Zero Duty Access: The EU will eliminate tariffs on 99.5% of Indian exports (by value) immediately upon implementation. This is a massive boost for labour-intensive sectors like textiles, leather, footwear, and gems & jewellery, which previously faced duties of 9-12%.
- Auto Sector Compromise: In a calibrated move, India will allow a quota of 250,000 European luxury vehicles annually at reduced duties (dropping from 110% to 10% over 5 years), protecting domestic mass-market manufacturers.
- Service Sector: India secured access to 144 EU service sub-sectors, benefiting IT/ITeS and skilled professionals.
Sectoral Deep Dive: Energy & Defence Surge
The Nifty Oil & Gas index was the day's standout performer, surging 3.40% to close at 11,762.
- ONGC (+8.18%): Hitting a fresh 52-week high. The trigger was a strategic agreement signed with Reliance Industries to share infrastructure for deepwater exploration in the Krishna Godavari basin, aiming to cut costs and speed up production.
- Bharat Electronics (BEL) (+9.2%): Investors cheered its Q3 results
- Asian Paints fell over 4% after reporting a 4.8% decline in consolidated net profit for Q3.
Conclusion
The Indian equity market closed on a strong footing, with the Nifty 50 reclaiming and sustaining levels above 25,300, signaling improving short-term sentiment. The rally was backed by declining volatility, sector-specific buying in Energy and Defence stocks, and optimism surrounding the landmark India-EU Free Trade Agreement.
However, derivatives data continues to indicate stiff resistance near the 25,500 zone, with heavy Call writing capping immediate upside. The Max Pain level at 25,300 and strong Put support at 25,000 suggest a range-bound market with a positive bias, as long as downside supports remain intact. Traders may continue to adopt a “buy on dips” approach while keeping a close watch on global cues, option OI shifts, and sector rotation.
FAQs
1. What does today’s Nifty 50 closing above 25,300 indicate?
Closing above 25,300 suggests a short-term bullish bias and confirms this level as an important pivot. Holding above it may encourage further consolidation or a gradual upside move.
2. Why is 25,500 a crucial resistance level for Nifty?
The 25,500 strike has the highest Call Open Interest, indicating heavy Call writing. This makes it a strong resistance where sellers are actively defending the upside.
3. What does the Put Call Ratio (PCR) of 0.85 mean?
A PCR of 0.85 indicates higher Call Open Interest compared to Put Open Interest, reflecting cautious to mildly bearish sentiment despite the market’s recent recovery.
4. How does the Max Pain level at 25,300 affect market movement?
The Max Pain level often acts as a magnet near expiry, as it is the point where option writers face minimal losses. Nifty may gravitate toward this level in the short term.
5. Why did Energy and Defence stocks outperform today?
Energy stocks surged on strategic developments and sector-specific triggers, while Defence stocks like Bharat Electronics gained on strong quarterly results and order book optimism.
6. What does the decline in India VIX signify?
The sharp drop in India VIX indicates reduced fear and expectations of lower near-term volatility, supporting stable and range-bound price action.
7. How can traders approach the market in the near term?
Traders may consider a range-trading strategy, buying near support zones and booking profits near resistance, while closely tracking F&O data and sectoral trends.
Disclaimer: This report is for informational purposes only and does not constitute financial advice. Please consult your financial advisor before making any investment decisions.
Happy Trading!
The Firstock Team