Support and Resistance Levels: Types & Strategies| 2026
Mastering the Support and Resistance levels with Firstock – A Smart Trader’s Guide
Have you ever wondered why the stock chart shows that the price is constantly moving between the same points? Not coincidental, it is called support and resistance. These are levels that are similar to unseen market ceilings and floors.
Now imagine if you could spot these levels easily and use them to make better trading decisions. That’s exactly what the support and resistance levels in Firstock helps you do.
It can be stocks, futures and options that you have an interest in or it can be as simple as learning the ropes, knowing these levels can dramatically make you more confident in your trading.
What Are support and resistance in share market?
Let’s say you're playing a game of ping-pong. The ball hits the table, bounces up, and then hits the top again before falling. The bottom point? That’s support. The top point? That’s resistance.
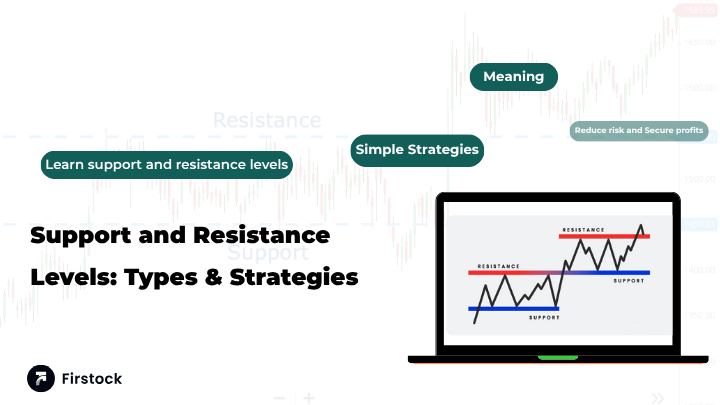
In trading, support is a price level where the stock tends to stop falling and start rising. Resistance is a price where it tends to stop rising and start falling.
These two levels are the building blocks of technical analysis—especially for traders who want to plan entries and exits more intelligently.
What Is a Support and Resistance Level?
Before diving into the tool, here’s a quick refresher:
- Support Level: The price level where a stock tends to find buying interest — it stops falling and may bounce upward.
- Resistance Level: The price level where a stock tends to face selling pressure — it stops rising and may reverse downward.
These levels help traders:
- Time entry and exit points
- Place stop-loss and target levels
- Manage risk and reward
- Identify market trends and reversals
Why These Levels Matter in Trading
Support and resistance aren’t just lines—they’re reflections of market psychology. Traders often place orders around these levels, making them powerful zones for prediction.
Knowing where price could reverse, pause, or break out helps you:
- Time your entries
- Set meaningful stop-losses
- Avoid jumping into trades blindly
- Maximize profits and minimize risks
Understanding Support – The Market’s Safety Net
Support is simply a price where buyers are likely to enter strong enough to stop a further decline. Imagine the market saying, “This stock is now too cheap.”
Example:
- Reliance falls to ₹ 1,300 multiple times.
- Each time, buyers enter and push it back up.
- ₹ 1,300 now acts as a support level.
Understanding Resistance – The Market’s Ceiling
Resistance works the opposite way. Here, sellers overpower buyers because the price feels “too high” at that level.
For example:
- Nifty 50 rises to 20,500.
- Sellers step in multiple times.
- The price fails to break that level.
That is resistance.
These levels repeat because traders remember them and base their future decisions on them.
Types of Support and Resistance Levels
Not all levels are created equal. Here are some key types:
1. Horizontal Support/Resistance
The classic way – using flat price levels.
2. Trendline Support/Resistance
From drawing upward or downward sloping lines.
3. Moving Averages
Dynamic support/resistance that moves with price.
4. Fibonacci Levels
A mathematical approach to finding pullback levels.
5. Psychological Levels
Round numbers like 10,000 or 100 make big impact.
Support and Resistance in Futures and Options Trading
Futures and options (F&O) traders especially rely on these signals. Why?
Because F&O trading involves leverage, so every move counts. Managing risk is key. Support and resistance levels guide key decisions like:
- Where to sell call or put options
- When to place stop-losses
- When to roll over futures contracts
- How to plan straddles, strangles, spreads, etc.
Knowing where markets could bounce or break makes trading smarter, not harder.
How Firstock Makes Support and Resistance Easy
When you use the Firstock stock trading app, not only do you get access to advanced charting tools, but everything is built with the modern trader in mind.
Here’s what makes Firstock stand out:
- Clean and interactive charts
- Mobile-friendly interface
- Real-time updates
- Great for futures and options traders who need a seamless experience
No manual struggle. No confusing settings. Just smarter trading.
Support and Resistance formula for Calculating
One common formula used is the Pivot Point method:
- Pivot Point (P) = (High + Low + Close) / 3
- First Support (S1) = (2 × P) – High
- First Resistance (R1) = (2 × P) – Low
- Higher levels (S2, R2, S3, R3) can also be derived from this formula.
Step-by-Step: Using the Support Resistance levels in Firstock
Step 1: Log In to Firstock
- Open the Firstock trading app.
- Enter your login credentials to access your dashboard.
Step 2: Select Your Chart
- Click on Charts from the menu.
- Choose your desired stock, index, or segment.
- Make sure your chart is set to candlestick mode for clearer visualization.
Step 4: Customize Your Settings
- Adjust settings such as:
- Timeframe (5-min, 15-min, hourly, daily)
- Number of historical levels
- Line styling (color, thickness)
Step 5: Interpret the Support & Resistance Lines
- Support Line: A horizontal line below the current price — potential bounce zones.
- Resistance Line: A line above the current price — potential selling zones.
- Use these to plan entries, exits, and stop-loss levels.
Step 6: Place Your Trade
- Buy near Support with stop-loss slightly below the level.
- Sell or short near Resistance with stop-loss slightly above.
- Use additional indicators like RSI, MACD for confirmation.
Understanding Breakouts and False Signals
A breakout happens when price crosses a support or resistance level with volume. But beware, not every breakout is reliable.
Breakout Confirmation Checklist:
- Strong volume
- Retest of the level
- Candlestick patterns confirming move
- Trend direction + momentum
Firstock allows you to zoom, mark, and track all these easily.
Trading Strategies Using Support and Resistance
Here are strategies you can try:
1. Support Bounce Buy
Wait for the price to touch a known support and buy with a stop below.
2. Resistance Rejection Sell
Sell near resistance expecting a pullback.
3. Breakout Buy
Once price crosses resistance with conviction.
4. Pullback Entry
After a breakout, wait for price to return to the level, then enter.
Combine these strategies with the support resistance levels for accuracy and easy execution.
Top Mistakes Traders Make with Support & Resistance
- Ignoring bigger trends
- Overloading charts with too many levels
- Not waiting for confirmation
- Blindly buying or selling at every test
- Misinterpreting false breakouts
The solution? Use tools that simplify things.
This is where using Firstock as your all-in-one discount broker app truly makes a difference.
Advanced Support & Resistance Tools in Firstock
Once you're comfortable, try:
- Adding Fibonacci retracements on top of support zones
- Using multiple timeframes to verify levels
- Enhances entry/exit precision and reduces analysis time
These features make Firstock a great platform for technical analysis-focused traders.
Practical Examples for F&O Traders
Let’s take Bank Nifty as an example.
- Support at 44,000
- Resistance at 44,800
If the price approaches 44,000 and shows reversal signs, you could sell a put option or go long futures.
If price breaks 44,800 with volume, you might buy a call or enter a long futures position for continuation.
Tools like the Firstock - Option Trading App let you visualize and execute this faster and with confidence.
Final Thoughts
Trading isn’t just about clicking buy or sell. It’s about making informed choices. And understanding support and resistance level equips you with insights that even beginners can use to navigate market moves effectively.
Whether you're an active trader or just dipping your toes into futures and options, the Firstock App for Options Trading India empowers you with smart visuals, intuitive tools,
So take advantage of every tool in your arsenal. Let the market speak through its price levels. And let Firstock be your partner in mastering them.
FAQs
1. What is support and resistance in the share market?
Support is a price level where a stock tends to stop falling due to strong buying interest, while resistance is a level where the stock tends to stop rising due to selling pressure. These levels help identify potential price reversals or breakouts.
2. Why are support and resistance levels important in trading?
Support and resistance levels help traders:
- Identify entry and exit points
- Place stop-loss and target orders
- Predict market reversals or trend continuation
- Manage risk and reward in trades
3. Do support and resistance formulas work for intraday trading?
Yes, formulas like Pivot Points, Fibonacci levels, and moving averages work well for intraday traders as they quickly show key price zones. Advanced platforms can calculate levels automatically for any timeframe.
4. Can resistance turn into support?
Yes. When price breaks above a resistance level with strength, that level often becomes a new support during future pullbacks. This is known as a role reversal.
5. What tools can help identify support and resistance levels automatically?
Platforms like Firstock, TradingView, and MetaTrader provide tools to, making technical analysis easier and faster.