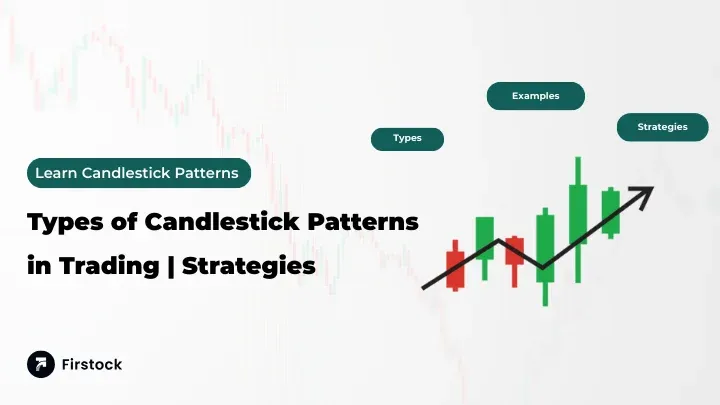
Types of Candlestick Patterns in Trading | Strategies

Types of Candlestick Patterns: Complete 2025 Guide for Indian Traders
If you’ve ever pulled up a stock chart on the NSE or BSE, you’ve definitely noticed all those green and red candlesticks flying up and down. At first, candlestick charts can look like a total mess—almost chaotic, but there’s real logic underneath. Every candlestick depicts waves of buying and selling pressure, allowing you to see the market's inclinations—be they cautious, optimistic, or perhaps even confused.
Knowing what to look for allows you to catch a peek of the momentum and underlying attitude behind those numbers. They’re not just shapes; they’re a direct window into trader confidence and uncertainty. Basically, it’s a sharp, effective way to spot shifts in direction before the broader market even catches on. So yeah, it might look overwhelming at a glance, but there’s a logic behind the movement.
This guide aims to explain the types of candlestick patterns that every trader should recognize. It will address what is candlestick pattern, methods for interpreting them, and frequently asked questions, including how many candlestick patterns are there. By the conclusion, readers should possess the ability to identify significant candlestick formations, thereby making more
What is Candlestick Pattern?
A candlestick pattern is a way of representing price movement during a specific time frame—like 5 minutes, 15 minutes, or even 1 day. Each candlestick shows four key points:
>Open price – where the stock started trading in that period
>Close price – where it ended
>High – the peak price during that time
>Low – the lowest price touched
A green (or white) candle usually means the price closed higher than it opened, showing buying strength. A red (or black) candle means the price closed lower, showing selling pressure.
Patterns are produced when numerous candles are grouped together. These candlestick patterns indicate if the market is likely to rise, fall, or remain flat. They are used every day by traders all over India, from those who trade Reliance or TCS equities to novices trying their hand at initial public offerings (IPOs).
How Many Candlestick Patterns Are There?
The difficult question now is: how many different candlestick patterns are there?
Technically, there are dozens, and if you add uncommon versions, some traders even assert that there are over 100. In actuality, though, you don't have to commit them all to memory. Most experts focus on 15–20 core patterns that occur regularly in the Indian stock market.
For simplicity, these patterns are usually divided into three categories:
1. Bullish candlestick patterns – show that the price may rise.
2. Bearish candlestick patterns – suggest the price could fall.
3. Indecision patterns – show confusion, where neither buyers nor sellers are in control.
Let’s go deeper into the most important ones.
Types of Candlestick Patterns: The Essentials
1. Doji – The Indecision Candle
When the open and closing prices are almost equal, a Doji is formed. It resembles a cross or a plus sign. This demonstrates the market's indecision. After a significant rally, a Doji may indicate that buyers are losing control. Similarly, a Doji may indicate that sellers are calming down following a significant decline.
In India, significant announcements such as the RBI's monetary policy or business outcomes are frequently accompanied with Doji patterns.
2. Hammer – A Bullish Reversal Signal
A Hammer looks like a small body on top with a long tail at the bottom. It usually forms after a stock has been falling. The long lower shadow shows sellers tried to push prices down, but buyers fought back and closed near the open.
For example, if you see a Hammer on Infosys stock after a week of selling, it might signal a rebound.
3. Inverted Hammer
Similar to the Hammer but flipped upside down. It also signals a possible bullish reversal but is slightly weaker.
4. Bullish Engulfing Pattern
This happens when a green candle fully covers (engulfs) the previous red candle. It shows buyers have taken strong control. On NSE stocks like HDFC Bank, spotting a Bullish Engulfing near support zones can be a great entry signal.
5. Bearish Engulfing Pattern
The opposite of the bullish version. A large red candle engulfs the previous green candle, showing sellers are back in control. This is often seen in overbought stocks before a correction.
6. Shooting Star – Bearish Signal
Looks like an upside-down hammer with a long upper shadow. It appears after a strong rally and warns of a possible trend reversal. If you notice a Shooting Star in a stock like Tata Motors after a big up-move, be cautious.
7. Morning Star – A Bullish Reversal Trio
This is a three-candle pattern:
- First candle is red (showing selling pressure).
- Second is small (showing indecision).
- Third is a big green candle (showing strong buying).
The Morning Star is one of the most reliable types of candlestick patterns for long-term investors.
8. Evening Star – Bearish Counterpart
Exactly opposite to the Morning Star. It forms at the top of an uptrend and warns that sellers are taking over.
9. Spinning Tops
These candles have small bodies and long wicks on both sides. They show market confusion. After a few Spinning Tops, you can expect a breakout either way.
10. Marubozu
Marubozu candlesticks are characterized by their complete bodies instead of having upper or lower wicks. A green Marubozu indicates that buyers controlled the market for the entire session, leading to continuous upward momentum.
Conversely, a red Marubozu indicates that sellers held control all the way, with buyers offering no resistance. In summary, it denotes a period with clear and steady market movement.
Simplified Candlestick Pattern Classification
If the sheer number of names looks difficult, consider candlestick patterns in smaller categories:
>Patterns of Continuation: Marubozu, Rising Three, and Falling Threes A session marked by consistent, strong market direction.
>Indecision Patterns – Doji, Spinning Top
So even though people ask, “how many candlestick patterns are there?”, the truth is—if you master 10–12 of the most common ones, you’re good to go.
Why Candlestick Patterns Matter in the Indian Stock Market
Indian traders often rely on technical indicators like RSI, MACD, and moving averages. But candlesticks give you a first-hand visual clue before indicators confirm the trend.
For example:
>During Budget announcements, you’ll see sudden candlestick shifts in banking and infrastructure stocks.
>Before IPO listings, candlestick behavior often shows whether big investors are quietly buying.
>On volatile days when FIIs and DIIs are active, candlesticks can reveal short-term market sentiment.
This is why understanding what is candlestick pattern and learning the types of candlestick patterns is so valuable.
Final Thoughts
Candlestick charts are more than just a display of vibrant bars. They are the behavior of traders' mentality. You can determine if the market is buying, selling, or hesitating by understanding the different kinds of candlestick patterns.You'll know just what to say the next time someone asks you, "What is a candlestick pattern?" Alternatively, "how many candlestick patterns are there?"
Furthermore, keep in mind that trading does not need memorizing every candlestick pattern. Finding the right ones at the right moment is critical. Once you've mastered this skill, you'll be better prepared to handle the stock market's volatility.
Also Read : How to Learn Trading for Beginners | 5 Easy Ways
FAQs
1: Simply put, what is a candlestick pattern?
It is a method of visualizing changes in stock prices. Every candle displays the open, high, low, and closing prices for a certain period of time.
2: What is the total number of candlestick patterns?
The majority of traders utilize 15–20 patterns, while some books list over 100. Nearly every situation in the real world is covered by these.
3: What kinds of candlestick patterns are most effective?
Indian traders frequently use reversal patterns like Hammer, Doji, and Engulfing. But when volume and support/resistance are added, efficacy rises.
4: Are profits assured by candlestick patterns?
No. They increase your chances of success, but you should always utilize them in conjunction with risk management.


