Deep Dives

Weekly Market Review: Indian Stock Market Last Week (02 – 06 March 2026)

Weekly Market Review: Indian Stock Market Last Week (02 – 06 March 2026)

Market Pulse: The Week in Review 📊 2nd to 6th March

The Indian equity market witnessed a steady retreat as frontline indices faced persistent selling pressure, leading to a notable breach of recent highs. The Nifty 50 closed with a decline of 2.89%, signaling a shift in momentum as the index slipped below key psychological levels. While the selling was consistent throughout the week, the lack of a strong recovery at lower levels suggests that bears currently hold the upper hand, keeping the short-term trend under pressure.

The broader market also displayed weakness, showing significantly more volatility and sharper corrections compared to the main benchmark. The Nifty Midcap 100 shed 2.91%, while the Nifty Smallcap 100 declined by 2.54%. This accelerated pace of selling in the mid and small-cap segments suggests that risk-off sentiment is deepening and starting to impact the broader market more heavily than the blue-chip stocks. Investors appear to be adopting a "wait-and-see" approach, leading to a gradual drying up of speculative interest.

Index Performance Snapshot

A quick review of the major indices shows the weekly market momentum.

1️⃣ Nifty 50

24,450.45 | -728.20 (-2.89%)

The Nifty 50 experienced a highly volatile week. The index closed at 24,450.45, dropping 315.45 points (1.27%) on Friday alone to settle below the critical 24,500 psychological level.

2️⃣ Nifty Midcap 100

57,393.35 | -1,722.25 (-2.91%)

While the decline was significant, the loss of over 1,722 points suggests that profit-booking is intensifying in mid-sized stocks. Traders are clearly shifting to a defensive stance as the index struggles to maintain its upward momentum.

3️⃣ Nifty Smallcap 100

16,498.9 | -430 (-2.54%)

While the slide of 2.54% suggests that profit-booking is intensifying in smaller-sized stocks, the loss of 430 points indicates that traders are shifting to a defensive stance.

Top Gainers (Nifty 500)

These stocks led the charge in the weekly stock market performance.

S.No.

Name

Sector

1wk Return %

1

Solar Industries

Chemicals

+12.20%

2

Jupiter Wagons

Engineering

+11.75%

3

Natl. Aluminium

Mining

+11.72%

4

Mazagon Dock

Defense

+11.10%

5

OneSource Specialty

Pharmaceuticals

+9.93%

Top Losers (Nifty 500)

The following stocks faced selling pressure in the stock market weekly performance.

S.No.

Name

Sector

1wk Return %

1

Netweb Technol.

IT

-16.55%

2

Mahanagar Gas

Gas Distribution

-13.98%

3

Aegis Vopak Term

Oil, Gas & Chemicals Logistics

-12.47%

4

Force Motors

Automobiles

-12.31%

5

Redington

IT & Mobility Distribution

-12.23%

F&O Corner

OI Analysis

Understanding Open Interest (OI) helps gauge weekly market sentiment and potential price movements.

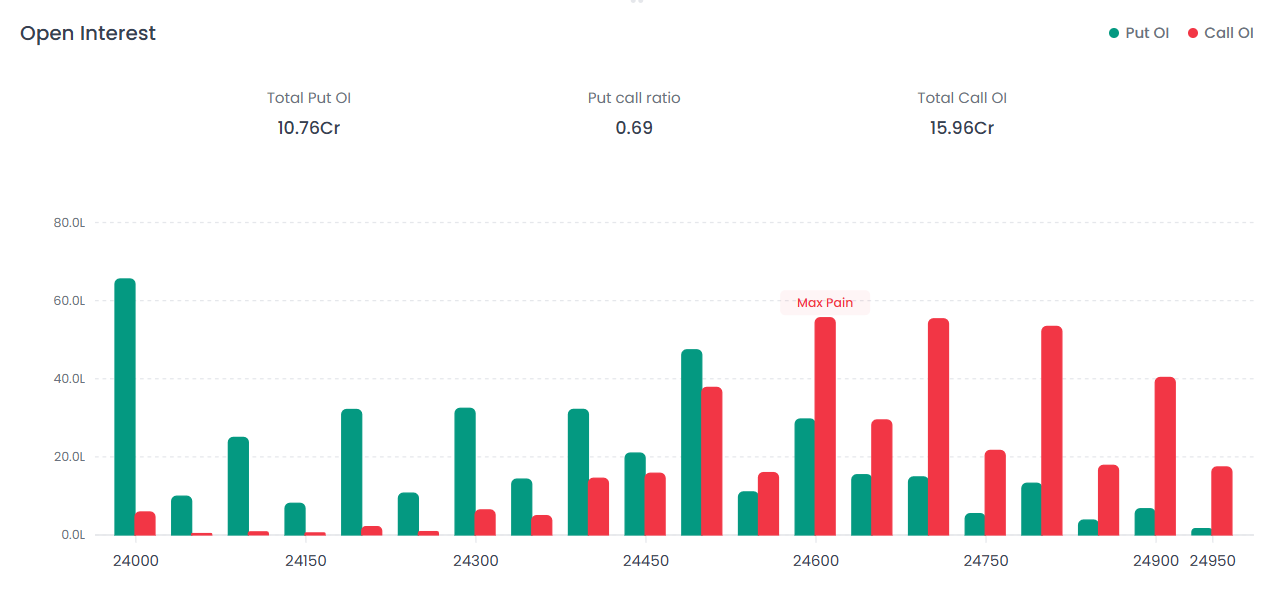
The Open Interest distribution reveals a heavily bearish bias in the current setup.

PCR: 0.69

This indicates that Call writing significantly outpaces Put writing.

Resistance

Massive Call OI buildup at 24,600, acting as a stiff hurdle.

Support

Highest Put OI positioned at 24,000, acting as a major psychological floor.

Max Pain Analysis

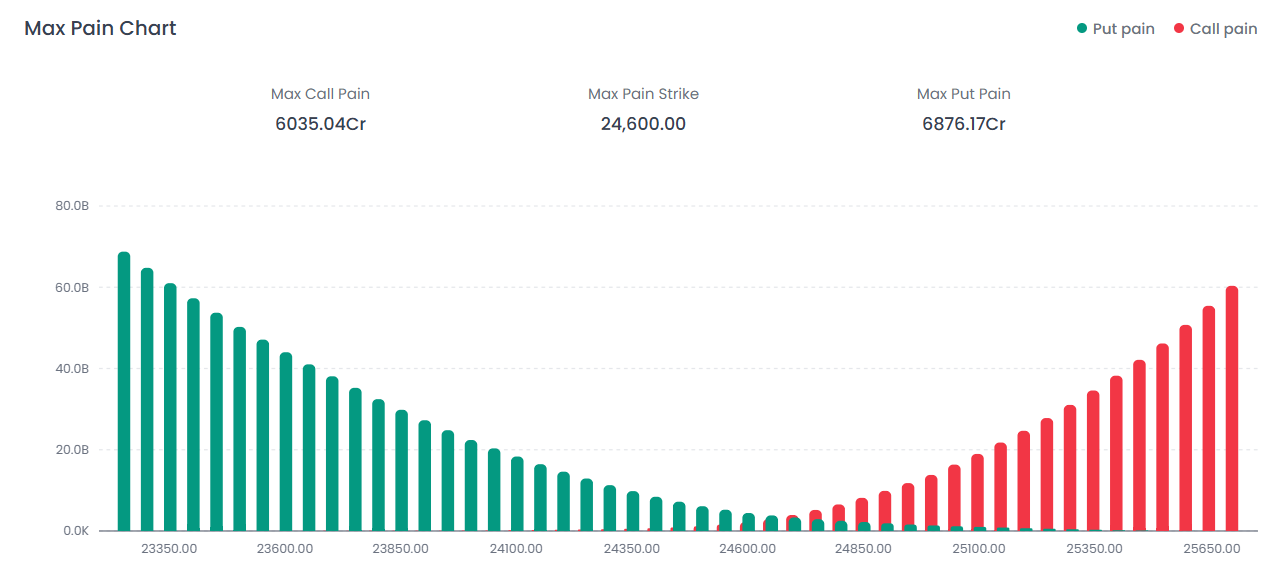
The Max Pain Strike is 24,600.00.

With the Nifty trading at 24,450.45, the index is below the Max Pain level.

This indicates that option sellers are under pressure, and resistance levels are shifting closer to the current price.

Volatility Index (India VIX)

India VIX: 19.88 | +6.17 (+45.08%)

Interpretation

The weekly market volatility surged sharply.

A 45% spike in VIX signals a dramatic increase in fear and uncertainty in the stock market.

The rise in volatility suggests wider price swings and expansion in option premiums.

Weekly Market Structure Summary

Indicator

Observation

Market Bias

Nifty Trend

Breakdown below 24,500

Bearish

Midcap Trend

Sharp correction

Weak

Smallcap Trend

Profit booking

Negative

PCR

0.69

Bearish

Max Pain

24,600

Resistance

VIX

19.88

High volatility

Major News & Upcoming Events

Major News of the Week

Geopolitical Tensions: Markets remained under pressure as escalating conflict in the Middle East between the US, Israel, and Iran led to widespread risk-off sentiment.

Crude Oil Surge: Brent crude prices surged toward $87/barrel, hitting a one-year high.

FII Selling Spree: Foreign Institutional Investors offloaded ₹15,000 crore in the cash market.

India VIX Spike: Market fear surged sharply with VIX rising 45% for the week.

Corporate Action: Natco Pharma gained attention following CDSCO approval for Semaglutide, while Mazagon Dock surged due to defense sector momentum.

Key Events for the Upcoming Week

Date

Time

Event

Mar 10, 2026

RBI Market Borrowing Auctions

Mar 11, 2026

05:00 PM

M3 Money Supply YoY

Mar 12, 2026

04:00 PM

Inflation Rate YoY

Mar 12, 2026

04:00 PM

Inflation Rate MoM

Mar 13, 2026

05:00 PM

Bank Loan Growth YoY

Final Weekly Market Outlook

The weekly stock market trend remains bearish as the Nifty has broken below key psychological levels.

Key observations from the stock market weekly analysis:

  • Rising volatility (VIX)
  • Aggressive FII selling
  • Strong Call writing resistance
  • Weak midcap and smallcap momentum

Unless the index reclaims 24,600–24,700, the market may remain under pressure in the coming week.

The 24,000 level will act as the next major support zone.

FAQs

1. How did the weekly stock market perform last week?

The Nifty 50 declined 2.89%, closing at 24,450.45.

2. Why did the stock market fall last week?

Key reasons include geopolitical tensions, rising crude oil prices, and heavy FII selling.

3. What does a PCR of 0.69 indicate?

A PCR below 1 signals bearish sentiment, meaning call writers dominate the market.

4. Why did India VIX rise sharply?

The 45% surge in VIX indicates increasing market uncertainty and expected volatility.

5. What are the key levels for next week?

Resistance: 24,600 Support: 24,000

Disclaimer: This report is for informational purposes only and does not constitute financial advice. Please consult your financial advisor before making any investment decisions.

Happy Trading!

The Firstock Team

Footer

Take control of your wealth with Firstock. Track your investments, trade wisely—all in one easy-to-use platform.

Download the App now

Invest in Stocks, Mutual Funds, IPOs, Bonds, ETFs & Futures, Options,

© 2025 Firstock. All rights reserved.

Firstock Broking Pvt Ltd

  • No 350,1st Floor, 36th A Cross 7th Main Rd 5th Block Jayanagar, Bengaluru, KA 560041.
  • NSE​ &​ BSE – SEBI Registration No.: INZ000260334
  • CDSL: Depository services – SEBI Registration No.: IN-DP-67-2015 Mutual Fund ARN: 132812
  • For any complaints pertaining to securities broking please write to [email protected] for DP related to [email protected] Please ensure you carefully read the Risk Disclosure Document as prescribed by SEBI.

    Attention Investors:

    Investments in the securities market are subject to market risks. Please read all related documents carefully before investing.

    Prevent Unauthorized Transactions in Your Trading/Demat Account:
    Update your mobile number and email ID with your stock broker or depository participant. Receive alerts and information about your transactions on your registered mobile number/email for all debit and other important transactions in your trading/demat account directly from the Exchange/CDSL on the same day.

    KYC is a one-time exercise while dealing in the securities market.
    Once KYC is completed through a SEBI-registered intermediary (broker, DP, mutual fund, etc.), you do not need to undergo the same process again when approaching another intermediary.

    No need to issue cheques when subscribing to an IPO.
    Simply write your bank account number and sign the application form to authorize your bank to make the payment in case of allotment. There is no worry about refunds, as the money remains in the investor's account.

    Procedure to file a complaint on SCORES (Easy & Quick): Register on the SCORES portal and keep the following mandatory details ready: Name, PAN, Address, Mobile Number, and Email ID.

    Benefits: Effective communication and speedy redressal of grievances.{" "}

    Dear Investor,

    If you are subscribing to an IPO, there is no need to issue a cheque. Please write your bank account number and sign the IPO application form to authorize your bank to make the payment in case of allotment. In case of non-allotment, the funds will remain in your bank account. As a business, we do not provide stock tips and have not authorized anyone to trade on behalf of others.

    Important:

    Stock brokers can accept securities as margin from clients only by way of a pledge in the depository system w.e.f. September 1, 2020.

    Update your email ID and mobile number with your stock broker or depository participant and receive OTPs directly from the depository on your registered email ID and/or mobile number to create pledges.

    Check your securities, mutual funds, and bonds in the consolidated account statement issued by NSDL/CDSL every month.

    Disclaimer:

    The Stock Exchange, Mumbai, is not in any manner answerable, responsible, or liable to any person for any acts of omission or commission, errors, mistakes, and/or violations—actual or perceived—by us or our partners, agents, associates, etc., of any rules, regulations, by-laws of the Stock Exchange, SEBI Act, or any other laws in force from time to time.

    The Stock Exchange, Mumbai, is not responsible or liable for any information on this website or for any services rendered by our employees or representatives. Please refer to BSE compliance for more details.

    Investor Alert:

    Investors are requested to note that stock broker Firstock Broking Private Limited (Firstock) is permitted to receive/pay money from/to investors only through designated bank accounts, named as "client bank accounts."

    Firstock is also required to disclose these client bank accounts to the Stock Exchange.

    Hence, you are requested to use only the following client bank accounts for any transactions in your trading account with us. The details of these accounts are also displayed by the Stock Exchanges on their website under “Know / Locate Your Stock Broker.”