Weekly Market Review: Indian Stock Market Last Week (09 – 13th March 2026)

Market Pulse: The Week in Review 📊
(9th to 13th Mar)
The Indian equity market faced a brutal week as a wave of intense selling pressure swept through the indices, leaving a trail of significant losses. The Nifty 50 was hit particularly hard, crashing by 5.31% to end at 23,151.10. This massive drop of nearly 1,300 points suggests that the bulls have completely lost their grip, with the index slicing through psychological support levels like butter. There was virtually no appetite for bargain hunting, indicating that the downward momentum is currently the dominant force in the market.
The carnage extended deep into the broader market, where mid and small-sized stocks felt the heat of a widening sell-off. The Nifty Midcap 100 plummeted by 4.59%, losing over 2,630 points in a single week. While the Nifty Smallcap 100 showed slightly more relative strength, it still retreated by 3.66% to close at 15,895.25. The sheer scale of these declines across the board points to an aggressive "risk-off" sentiment, with investors scrambling to preserve capital rather than chasing growth.
Weekly Stock Market Performance Snapshot
A quick review of the major indices shows the weekly market momentum.
1. Nifty 50
23,151.10 | -1,299.35 (-5.31%)
The benchmark Nifty 50 faced a grueling week, witnessing a sharp correction of over 5%. The index struggled to find support as aggressive selling pressure pushed it down to the 23,151 level. This significant weekly drop reflects a cautious shift in investor sentiment, as the market failed to sustain higher levels amid global and domestic headwinds.
2. Nifty Midcap 100
54,761.10 | -2,632.25 (-4.59%)
The midcap segment was not spared from the broader market rout, losing more than 2,600 points over the week. This decline of 4.59% highlights a period of heavy liquidation in mid-sized companies. The breach of key support levels suggests that the earlier "buy-on-dips" enthusiasm is being replaced by a more conservative "wait-and-watch" approach.
3. Nifty Smallcap 100
15,895.25 | -603.65 (-3.66%)
While the smallcap index showed slightly more resilience compared to its larger peers, it still ended the week deep in the red. A drop of over 600 points indicates that even the high-growth small-cap space is feeling the heat of the broader sell-off. Investors are increasingly prioritizing capital preservation, leading to noticeable cooling in this previously high-flying segment.
Top Gainers – Weekly Stock Market
Top Losers – Weekly Market
F&O Corner – Weekly Market Derivatives Analysis
OI Analysis
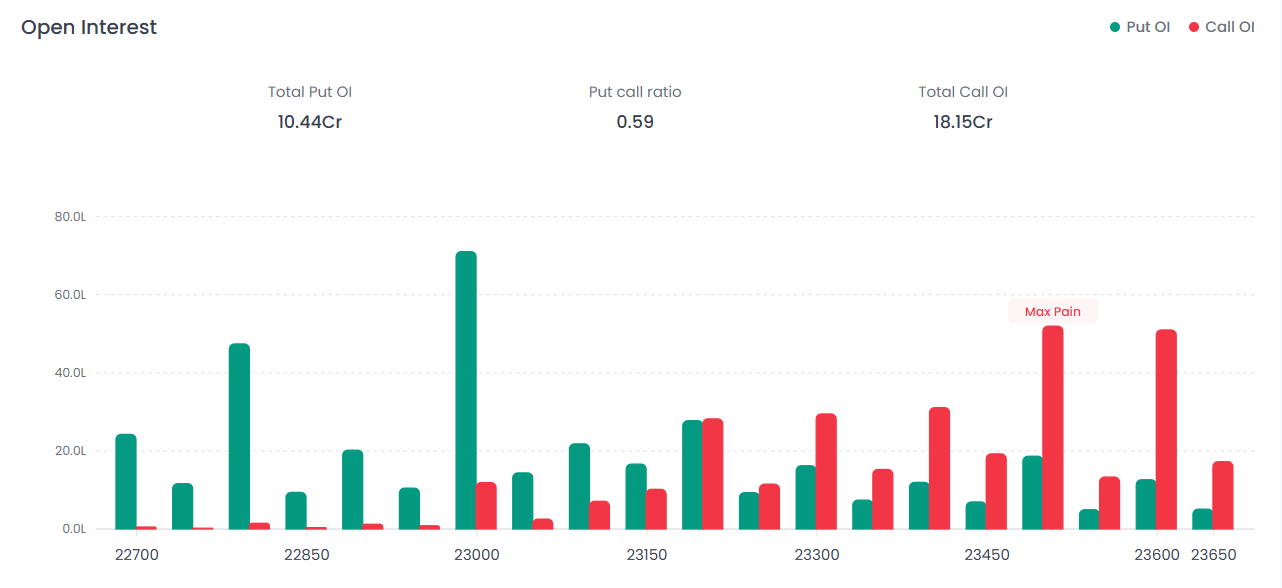
Understanding Open Interest (OI) helps gauge sentiment in the weekly stock market.
The Open Interest (OI) data paints a picture of intense bearish domination as we head into the next session. The Put-Call Ratio (PCR) has compressed to a very low 0.59, signaling that Call writers are aggressively outnumbering Put writers.
Resistance
Massive Call OI buildup is visible at the 23,500 strike. The 23,500 level, in particular, is marked as the "Max Pain" point, making it a formidable hurdle for any recovery attempt.
Support
On the downside, the most significant defensive wall is anchored at the 23,000 strike, where the highest Put OI is concentrated.
Max Pain Analysis
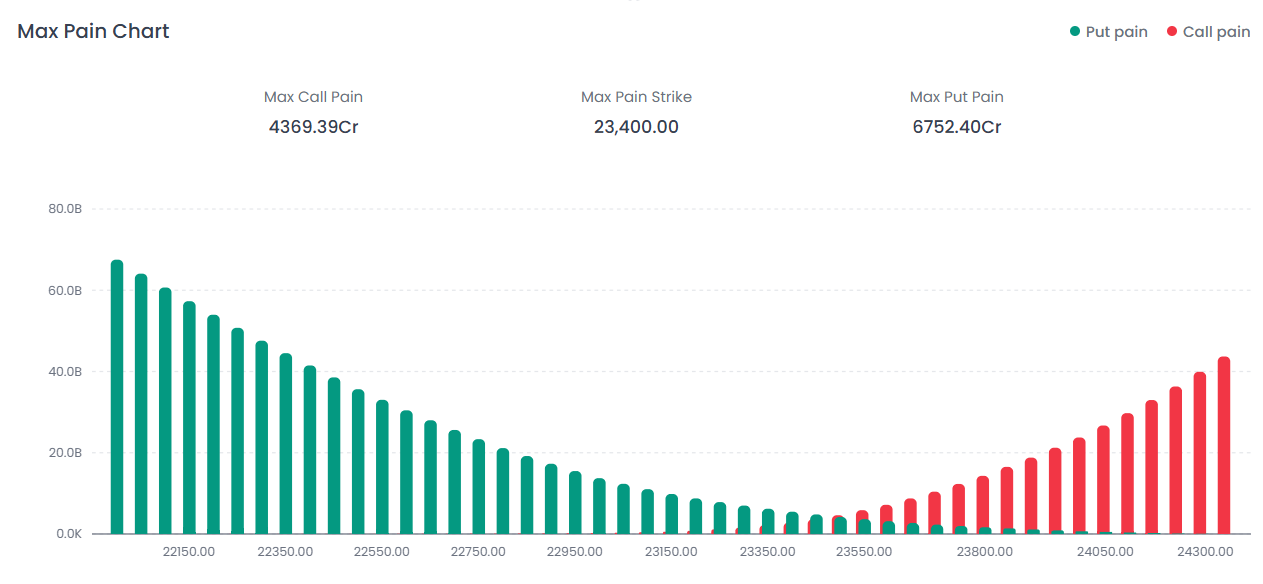
The Max Pain Strike has shifted significantly to 23,400.00.
With the Nifty 50 currently at 23,151.10, the index is trading well below this point. This shift confirms that resistance is descending, effectively capping any near-term relief rallies.
Volatility Index – India VIX
India VIX: 22.64 | +2.76 (+13.91%)
Interpretation
The India VIX witnessed a sharp surge of 13.9%, reaching 22.64. This spike in the Fear Index reflects rising trader anxiety and extreme volatility expectations.
For traders, this means:
- Higher option premiums
- Wider intraday swings
- Increased market uncertainty
- Risk-off sentiment dominating
Major News Impacting the Weekly Market
Geopolitical Conflict Escalates
Markets plunged as US–Iran tensions intensified, including naval strikes and closure threats around the Strait of Hormuz.
Crude Oil Breakout
Brent crude surged above $100 per barrel, putting pressure on India’s macroeconomic outlook and currency stability.
Massive FII Outflows
Foreign Institutional Investors accelerated their capital withdrawal from Indian equities, worsening the market fall.
India VIX at Multi-Month High
The Fear Gauge surged 13.91%, indicating extreme uncertainty and volatility.
Sectoral Impact
Most sectors corrected heavily, while defensive plays and fertilizer stocks like FACT attracted speculative interest.
Key Economic Events Next Week
Weekly Market Technical Summary
Stock Market Weekly Outlook
The weekly stock market experienced one of the sharpest corrections in recent months. With geopolitical tensions escalating and crude oil prices surging, the short-term trend remains heavily bearish.
However, the 23,000 level will act as a crucial support zone. A break below this level could trigger another round of panic selling.
For the coming week, traders should expect:
- High volatility
- Sharp intraday swings
- Short covering rallies
- Defensive sector rotation
Until the index reclaims 23,500–23,700, the broader trend will remain under bearish pressure.
FAQs
1. How did the weekly market perform last week?
The Nifty 50 declined 5.31%, closing at 23,151.10, marking one of the sharpest weekly corrections.
2. Why did the Indian stock market fall sharply?
Key reasons include:
- Rising US–Iran geopolitical tensions
- Crude oil prices crossing $100
- Heavy FII outflows
- Increasing India VIX volatility
3. What does PCR 0.59 indicate?
A PCR of 0.59 indicates strong bearish sentiment with aggressive Call writing.
4. What is the key support level for Nifty?
The most critical support for the coming week is 23,000.
5. What does the India VIX surge mean?
A VIX above 22 indicates high volatility and increased market fear, suggesting large price swings ahead.
Disclaimer: This report is for informational purposes only and does not constitute financial advice. Please consult your financial advisor before making any investment decisions.
Happy Trading!
The Firstock Team