Weekly Market Review: Indian Stock Market Last Week(12 Jan – 16 Jan 2026)

Market Pulse: The Week in Review, Indian Stock Market Weekly Analysis, Consolidation Outlook, F&O Data & Key Events
The Indian equity market witnessed a range-bound and consolidative session, with frontline indices ending virtually flat while broader markets showed modest resilience. Nifty 50 closed with a marginal gain of 0.04%, signaling a pause in directional momentum as the index hovers near key levels. This lack of decisive movement suggests a tug-of-war between bulls and bears.
The broader market displayed slightly better performance but remained cautious. Nifty Midcap 100 rose 0.20%, while Nifty Smallcap 100 gained 0.46%. Unlike the heavy unwinding seen in previous risk-off scenarios, this indicates that speculative interest is holding up, though aggressive buying is notably absent.
The session points to a wait-and-watch approach across the market. With the index closing flat and trading below major resistance zones, the market is likely to remain in a consolidation phase before establishing a clear trend.
Index Performance Snapshot
A quick review of the major indices shows the market momentum for the week.
1. Nifty 50
25,694.35 | +11.05 (+0.04%)
Nifty 50 ended flat to positive, reflecting a pause after recent moves. The marginal close suggests indecision among traders, with the index taking a breather. As long as it sustains these levels, the focus remains on whether it can overcome immediate resistance or if selling pressure will re-emerge.
2. Nifty Midcap 100
59,867.8 | +119.65 (+0.20%)
The Midcap index slightly outperformed the frontline benchmark, ending in the green. This suggests that while risk appetite is not exuberant, there is no immediate panic selling in broader pockets. The index is attempting to stabilize, though follow-up buying is needed to confirm strength.
3. Nifty Smallcap 100
17,362.3 | +79.65 (+0.46%)
Smallcaps saw the highest relative gains among the three, rising nearly half a percent. This indicates pockets of buying interest in specific stocks. However, the overall environment remains tentative, and this move looks more like consolidation than a breakout.
Top Gainers (Nifty 500)
These stocks led the charge, delivering the highest returns this week.
Top Losers (Nifty 500)
The following stocks faced selling pressure and registered the week's biggest declines.
F&O Corner – OI Analysis
Understanding Open Interest (OI) helps gauge market sentiment and potential price movements for the next expiry.

Near Resistance for the Week: 26,000Call OI is dominant here with the tallest green bar on the chart. Significant Call writing has created a massive "Ceiling" at this level, indicating traders do not expect the market to cross this zone easily.
Near Support for the Week: 25,500The highest Put OI is observed at this strike, indicated by the tall red bar. This serves as the primary "Floor" or safety net where buyers are likely to step in.
Put Call Ratio (PCR): 0.66 | Current Scenario: BEARISH
A PCR below 1.0 indicates aggressive Call writing. While slightly higher than extreme lows, this suggests the market sentiment remains skewed towards "Sell on Rise," with bears controlling the trend and capping the upside.
Interpretation:The market continues to exhibit bearish sentiment, evidenced by the Total Call OI (18.81 Cr) significantly outpacing the Total Put OI (12.32 Cr). The index is facing immediate pressure starting from 25,800, where substantial Call writing is visible, leading up to a stiff resistance wall at 26,000. On the downside, the first major line of defense for the bulls remains at 25,500. The PCR of 0.66 confirms that Call writers remain confident, suggesting that any upside momentum is likely to be met with fresh selling unless the resistance at 26,000 is decisively broken.
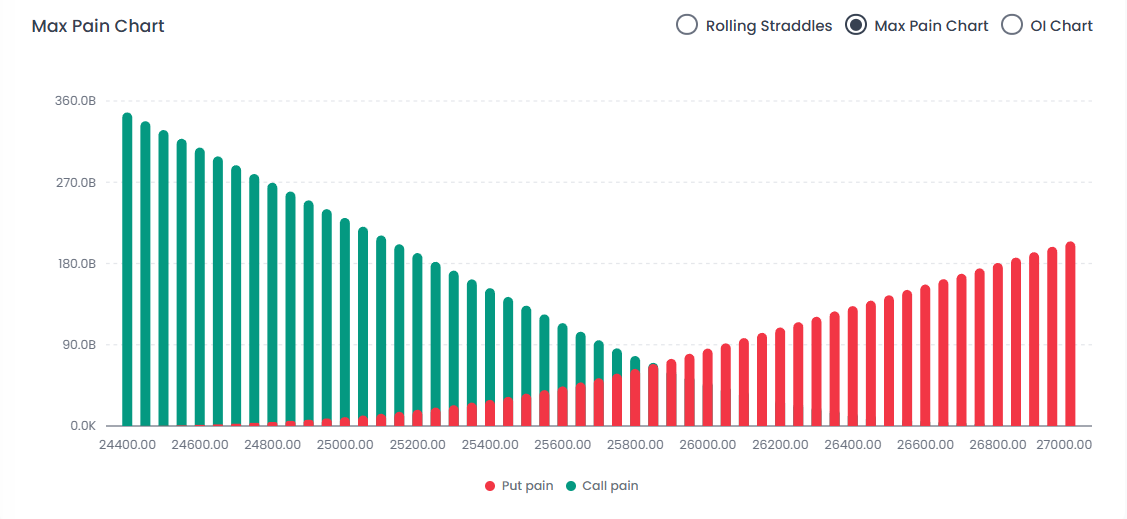
Max Pain Analysis
Interpretation:The Max Pain level is currently positioned at 25,800, which is higher than the market's closing price of 25,694, though the gap has narrowed significantly compared to previous sessions.
The "Magnet" Effect:The market often gravitates toward this level by expiry to inflict the least amount of loss on Option Writers (smart money). This suggests a potential tendency for the index to attempt a pullback toward 25,800.
Conflict with Trend:A notable shift has occurred in which the Max Pain level has moved lower (previously near 26,000) to 25,800. This downward adjustment confirms that option writers are aggressively lowering the "ceiling" in response to bearish momentum. While the price is still below the Max Pain level, this shift indicates that the resistance overhead is becoming heavier and moving closer to the current price, limiting the scope for a significant recovery.
Volatility Index (India VIX)
The 'Fear Index' reflects the market's expectation of volatility.
India VIX: 11.3725 | +0.4475 (+4.10%)
Interpretation:The India VIX has registered a noticeable uptick, climbing to 11.37 with a gain of +4.10%. While the absolute value remains relatively low compared to historical extremes, this rise signals a departure from deep complacency and a renewed demand for hedging. This expansion in volatility contributes to a rise in option premiums (Vega expansion).
Major News & Upcoming Events
Major News of the Week
- Shadowfax Technologies IPO opens on Jan 20
- Infosys Q3 profit fell 9.6% QoQ
- SEBI reviewing pre-open session norms
- Passive fund inflows rose 22%
- December retail inflation rose to 1.33%
- Commodities showed mixed trends
- Global markets reacted to tariff and policy signals
Key Events for the Upcoming Week
Indian Stock Market Last Week Graph – Consolidation Explained
The Indian stock market last week graph reflects a classic range-bound structure:
- Flat benchmark close
- Higher relative strength in mid & small caps
- Declining directional momentum
- Rising volatility at low absolute levels
Such price action usually precedes a volatility expansion phase, making upcoming sessions crucial.
Weekly Market Structure – At a Glance
Weekly Trading & Investment Approach (Educational)
For Index Traders:
- Sell on rise near 25,800–26,000
- Range trading until breakout confirmation
For Options Traders:
- Prefer defined-risk strategies
- Rising VIX favors option buyers
For Long-Term Investors:
- Consolidation phases often offer selective accumulation opportunities
Conclusion
This weekly stock market report highlights a pause in momentum rather than trend reversal. The Indian stock market remains in consolidation mode, with derivatives data suggesting caution while price action signals balance.
The coming week, driven by macro data and global cues, is likely to determine the next directional move.
Also Read: How to Trade High Volatility Markets
FAQs
1. What does weekly market consolidation mean?
Weekly market consolidation means prices are moving within a narrow range, showing indecision between buyers and sellers before a major directional move.
2. How did the Indian stock market perform last week?
The Indian stock market ended largely flat. Nifty 50 gained 0.04%, while midcaps and smallcaps showed mild outperformance, indicating cautious stability.
3. What does the Indian stock market last week graph indicate?
It indicates a range-bound structure with reduced momentum, suggesting the market is preparing for a potential breakout or breakdown.
4. Is the weekly stock market trend bearish?
Short-term sentiment remains mildly bearish due to Call writing and low PCR, but price action reflects consolidation rather than aggressive selling.
5. Why is India VIX rising despite a flat market?
A rising VIX during consolidation indicates growing uncertainty and increased demand for hedging ahead of a potential directional move.
6. What are the key levels to watch next week?
Resistance remains near 26,000, while strong support lies at 25,500.
Disclaimer:This report is for informational purposes only and does not constitute financial advice. Please consult your financial advisor before making investment or trading decisions.
Happy Trading 📊— The Firstock Team