Weekly Market Review: Indian Stock Market Last Week(19 Jan – 23 Jan 2026)

Weekly Market Review: Indian Stock Market Performance Last Week – 23rd January
The Indian equity market witnessed a severe sell-off, with frontline indices facing intense pressure while broader markets succumbed to aggressive liquidation. Nifty 50 closed with a sharp decline of 2.51%, signaling a decisive breakdown in momentum as the index plummeted below key support levels. The lack of buying interest at lower levels suggests a dominant bearish grip on the market, with sellers controlling the trend throughout the week.
The broader market displayed significant weakness, severely underperforming the benchmarks. Nifty Midcap 100 plunged 4.55%, while Nifty Smallcap 100 crashed 5.81%. Unlike the resilience seen in previous sessions, this heavy unwinding indicates that panic selling has set in, with speculative interest drying up as risk-off sentiment takes center stage.
The session points to a defensive and cautious environment across the market. With the index closing deep in the red and breaching major support zones, the market is likely to remain in a corrective phase, with the focus now shifting to whether the bulls can defend lower levels or if the selling pressure will intensify further.
From a weekly market perspective, this phase reflects a clear shift from consolidation to active distribution. The weekly stock market trend has decisively turned defensive, while the stock market weekly structure now signals elevated downside risk. The Indian stock market last week graph clearly captures this breakdown, showing synchronized weakness across large-caps, mid-caps, and small-caps.
Indian Stock Market Last Week Graph – Structural Breakdown
The Indian stock market last week graph highlights three critical developments:
- Breakdown of key supports in Nifty 50
- Aggressive liquidation across midcap and smallcap segments
- Sharp expansion in volatility confirming panic-driven selling
In historical weekly stock market cycles, such synchronized declines across all market segments typically indicate the start of a corrective or consolidation phase rather than a short-lived pullback.
Index Performance Snapshot – Weekly Stock Market Overview
A quick review of the major indices shows the market momentum for the week.
📊 Weekly Index Performance Table
Nifty 50 – Weekly Market Performance Analysis
Nifty 50: 25,048.65 | -645.70 (-2.51%)
Nifty 50 ended with a sharp decline, reflecting intense selling pressure after recent moves. The significant drop signals a bearish shift in sentiment, with the index slipping well below key levels. As bears tighten their grip, the focus remains on whether the index can find immediate support or if the correction will deepen further.
From a stock market weekly standpoint, this move confirms:
- Breakdown below major technical supports
- Absence of dip-buying interest
- Strong dominance of sellers throughout the week
In the broader weekly market cycle, such decisive weekly breakdowns often lead to continued volatility and extended consolidation before stability returns.
Nifty Midcap 100 – Weekly Stock Market Collapse
Nifty Midcap 100: 57,145.65 | -2,722.15 (-4.55%)
The Midcap index witnessed a brutal sell-off, significantly underperforming the frontline benchmark. This sharp decline indicates that risk appetite has evaporated, leading to panic selling across broader pockets. The index failed to stabilize, suggesting that aggressive unwinding and profit booking are now dictating the trend.
Midcaps historically act as early warning indicators in the weekly stock market cycle. Such deep declines reflect:
- Institutional risk reduction
- Retail capitulation
- Breakdown of momentum across growth stocks
Nifty Smallcap 100 – Weekly Market Panic Phase
Nifty Smallcap 100: 16,352.75 | -1,009.55 (-5.81%)
Smallcaps faced the brunt of the selling pressure, registering the steepest decline among the three indices. This massive drop of nearly 6% signals a complete risk-off sentiment, with aggressive liquidation in high-beta stocks. The severity of the fall indicates that confidence in the broader market has been severely shaken, with speculative interest drying up completely.
In any weekly market structure, such steep smallcap declines typically occur during:
- Forced liquidation phases
- Margin unwinding cycles
- Institutional derisking events
Top Gainers (Nifty 500) – Weekly Market Survivors
These stocks led the charge, delivering the highest returns this week.
📈 Weekly Top Gainers Table
These gainers reflect defensive rotation and selective accumulation, a common feature in bearish weekly stock market phases.
Top Losers (Nifty 500) – Weekly Market Damage Report
The following stocks faced selling pressure and registered the week's biggest declines.
📉 Weekly Top Losers Table
Such deep losses across sectors confirm that this stock market weekly decline is broad-based rather than sector-specific.
F&O Corner – Weekly Market Derivatives Outlook
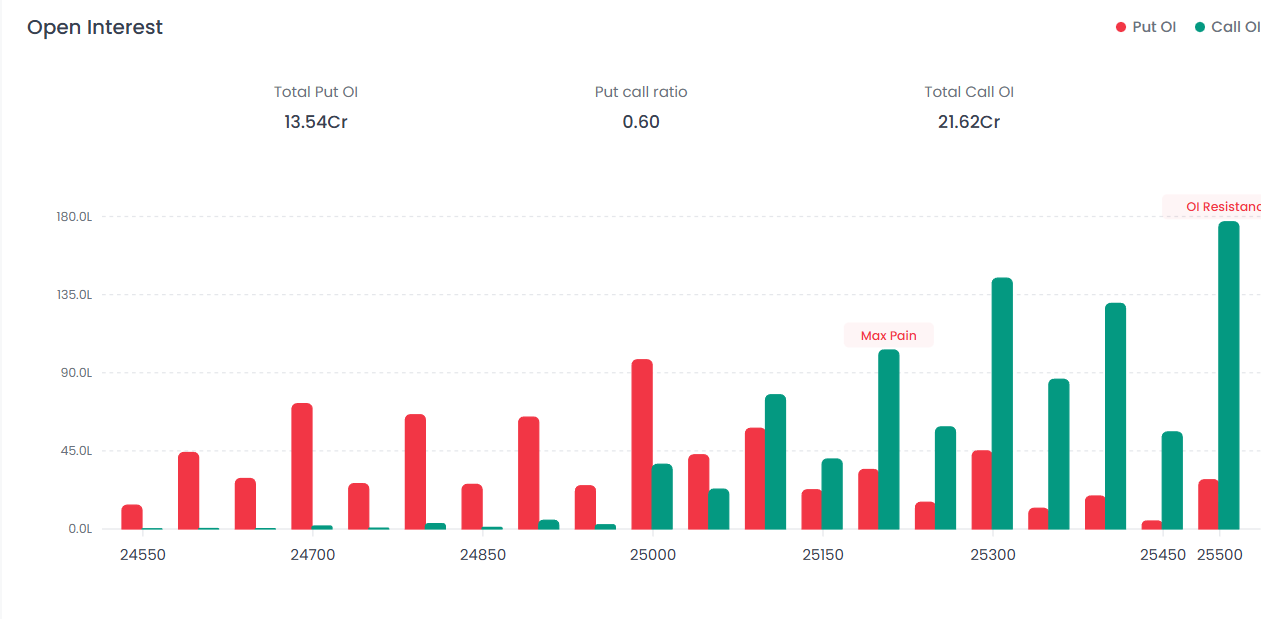
Understanding Open Interest (OI) helps gauge market sentiment and potential price movements for the next expiry.
📊 Weekly F&O Levels
Interpretation
The market continues to exhibit bearish sentiment, evidenced by the Total Call OI (21.62 Cr) significantly outpacing the Total Put OI (13.54 Cr). The index is facing immediate pressure, leading up to a stiff resistance wall at 25,500. On the downside, the first major line of defense for the bulls remains at 25,000. The PCR of 0.60 confirms that Call writers remain confident, suggesting that any upside momentum is likely to be met with fresh selling unless the resistance at 25,500 is decisively broken.
This derivatives positioning strongly reinforces the bearish weekly market narrative.
Max Pain Analysis – Weekly Stock Market Magnet Zone

Interpretation
The Max Pain level is currently positioned at 25,200, which acts as a pivotal point for the expiry.
The “Magnet” Effect
The market often gravitates toward this level by expiry to inflict the least amount of loss on Option Writers (smart money). This suggests a potential tendency for the index to attempt a pullback toward 25,200.
Conflict with Trend
A notable shift has occurred in which the Max Pain level has moved lower to 25,200. This downward adjustment confirms that option writers are aggressively lowering the “ceiling” in response to bearish momentum. While the price may fluctuate, this shift indicates that the resistance overhead is becoming heavier and moving closer to the current price, limiting the scope for a significant recovery.
This is a critical signal in the weekly stock market framework.
India VIX – Weekly Market Volatility Explosion
India VIX: 14.1925 | +2.82 (+24.80%)
The India VIX has registered a significant surge, climbing to 14.19 with a gain of +24.80%. While the absolute value remains relatively low compared to historical extremes, this rise signals a departure from deep complacency. This expansion in volatility contributes to a rise in option premiums (Vega expansion).
In the weekly market cycle, rising VIX after prolonged calm typically marks:
- Beginning of corrective phase
- Higher intraday volatility
- Increased hedging activity
Major News & Events Impacting the Weekly Stock Market
Major News of the Week
- PhonePe IPO Exit
- Rupee at All-Time Low (91.69)
- IIFL Finance Special Audit
- Jio BlackRock ETF Expansion
- IFSCA Algo Trading Rules
- Eternal Q3 Volatility
- US-Greenland Diplomatic Tension
- Natural Gas Historic Rally
- Yen & Japan Bond Turmoil
- Gold Surges Above $4,950
- Trump vs EU Trade Tensions
These developments added to uncertainty and amplified bearish sentiment in the weekly stock market environment.
Key Events to Watch – Upcoming Weekly Market Triggers
📅 Economic Calendar Table
These events may decide the next directional move in the weekly market.
Weekly Market Outlook – Strategic Perspective
- Traders: Focus on sell-on-rise strategies
- Options Traders: Favor volatility-based spreads
- Investors: Avoid aggressive fresh buying until stability returns
Final Verdict – Weekly Market Summary
The weekly market reflects severe risk-off sentiment, broad-based liquidation, and rising volatility. The weekly stock market has decisively shifted into a corrective phase, while the stock market weekly structure warns of further downside unless strong support emerges near 25,000. The Indian stock market last week graph clearly confirms this breakdown across all segments.
FAQs
1. How was the Indian stock market last week?
The Indian stock market last week witnessed a sharp sell-off, with Nifty 50 falling 2.51%, midcaps plunging 4.55%, and smallcaps crashing 5.81%, indicating strong bearish momentum.
2. What does the weekly market trend indicate now?
The weekly market trend indicates a clear corrective phase with panic selling, rising volatility, and breakdown below key support levels.
3. Which segment performed worst in the weekly stock market?
Smallcap stocks performed worst, with Nifty Smallcap 100 declining nearly 6%, reflecting complete risk-off sentiment.
4. What does the Indian stock market last week graph show?
The Indian stock market last week graph shows synchronized breakdown across large, mid, and smallcap indices, confirming a broad-based bearish trend.
5. Is rising India VIX bad for the weekly stock market?
Yes, rising India VIX signals increasing fear and volatility, which often accompanies corrections and unstable market phases.
6.What are the key support and resistance levels now?
Key support lies at 25,000 while strong resistance stands near 25,500 based on weekly derivatives data.
Disclaimer: This report is for informational purposes only and does not constitute financial advice. Please consult your financial advisor before making any investment decisions.
Happy Trading!
The Firstock Team