Weekly Market Review: Indian Stock Market Last Week(2Feb – 6 Feb 2026)

Market Pulse: The Week in Review
The Indian equity market witnessed a week of consolidation and selective sector rotation, as the benchmark indices navigated through post-budget assessments and global cues. The Nifty 50 managed to close in the green, showcasing resilience by holding above critical support zones, while the broader markets took a breather, witnessing minor profit-booking after their recent outperformance.
The session highlights a market that is stabilizing. With the India VIX cooling off significantly below the 12-mark, the "fear factor" has diminished, paving the way for stock-specific action. The sentiment remains cautiously optimistic as the index hovers near its Make-or-Break levels, with 26,000 acting as the psychological barrier for the next leg of the rally.
Index Performance Snapshot
A quick review of the major indices shows the market momentum for the week ending February 6, 2026.
1. Nifty 50
25,693.70 | +359.9 (+1.42%)
The Nifty 50 ended the week with a marginal gain, reflecting a tug-of-war between bulls and bears. The index successfully defended the 25,600 zone, signaling that the underlying trend remains positive despite the lack of aggressive buying momentum. The closing level suggests that the market is in a "wait-and-watch" mode, consolidating its gains before attempting to conquer the 26,000 peak.
2. Nifty Midcap 100
59,502.70 | +1065.20 (+1.82%)
The Midcap index paused its rally, closing virtually flat. After a strong run-up, this consolidation is healthy, allowing the overbought conditions to neutralize. The index remains poised near the 60,000 mark, and a breakout above this level could trigger fresh momentum in high-beta stocks.
3. Nifty Smallcap 100
16,938.65 | +176.80 (+1.06%)
Smallcaps witnessed mild profit-booking, underperforming the benchmarks slightly. The decline of roughly 0.3% indicates a shift in risk appetite, with traders booking profits in recent winners. However, the structure remains intact as long as the index holds above the 16,800 support zone.
Top Gainers (Nifty 500)
Top Losers (Nifty 500)
F&O Corner
OI Analysis
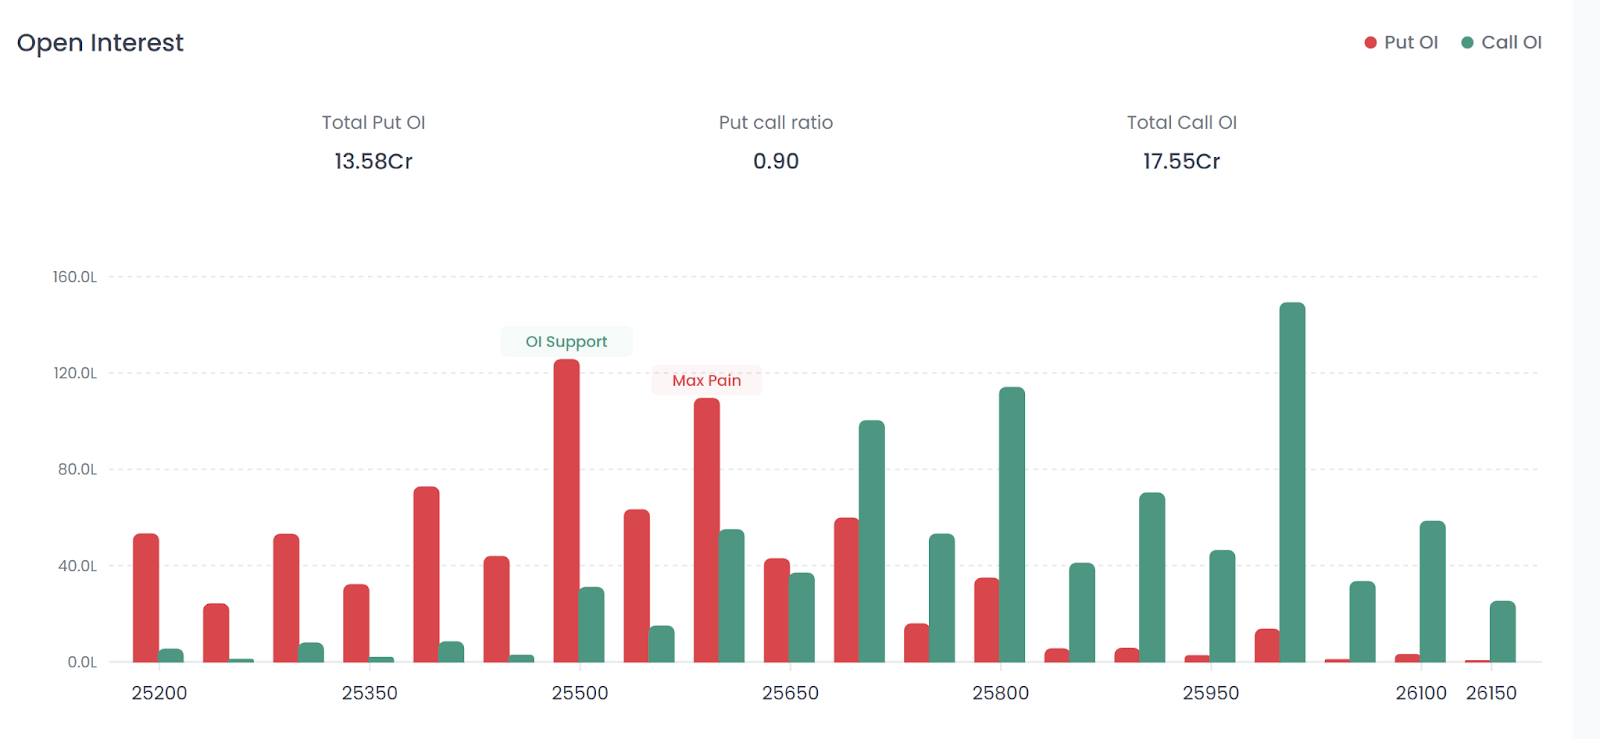
Understanding Open Interest (OI) helps gauge market sentiment and potential price movements for the upcoming expiry.
Near Resistance for the Week: 26,000 Call OI is dominant. The option chain data shows massive Call writing at this strike, creating a stiff "Ceiling." Traders clearly do not expect the Nifty to cross this psychological mark easily in the immediate short term.
Near Support for the Week: 25,500 This strike holds the highest Put OI. This acts as the primary "Floor," where smart money has written Puts, expecting the market to hold this level.
Put Call Ratio (PCR): 0.90 | Current Scenario: NEUTRAL
Interpretation: A PCR of 0.90 indicates a balanced market with a slight tilt towards caution. The Total Call OI (17.55 Cr) is higher than the Total Put OI (13.58 Cr), confirming that Call writers currently have the upper hand, keeping the upside capped.
Max Pain Analysis
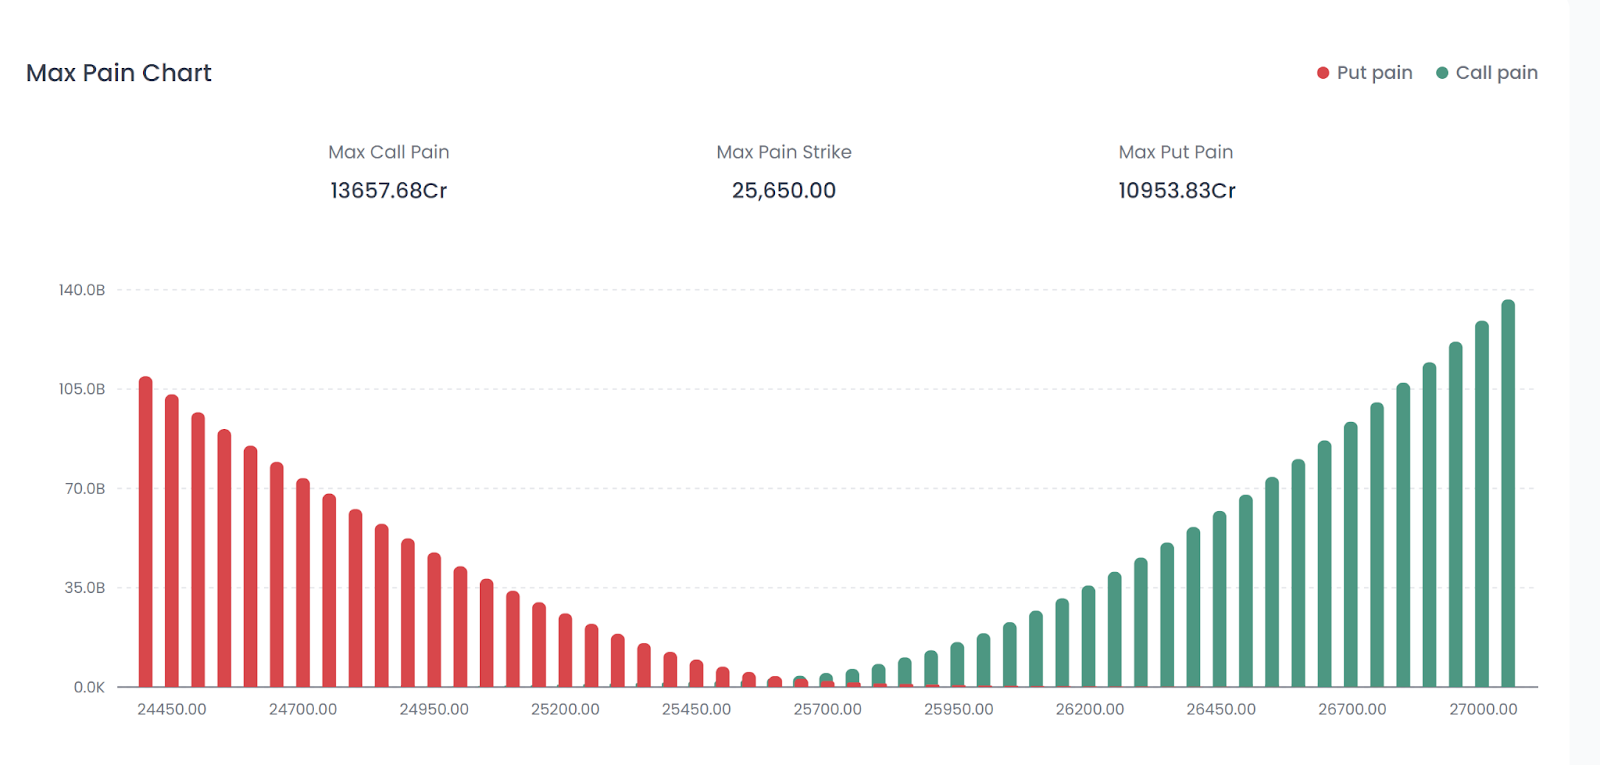
Max Pain Strike: 25,650.00
Interpretation: The Max Pain level is at 25,650, which is very close to the current closing price (25,693). This suggests the market is in a "Pinning" zone. Option writers will try to keep the index expiring near this level to maximize their premium retention.
Volatility Index (India VIX)
India VIX: 11.94 | -3.1550 (-20.9%)
Interpretation: The India VIX has cooled off further, dropping below 12. This -20.9% decline suggests that the "Event Risk" (Budget/Policy) is now fully priced out, and the market has entered a zone of stability. However, such low VIX levels can also indicate complacency, often preceding sudden spikes in volatility.
Weekly Market Structure Summary
Major News & Upcoming Events
Major News of the Week
Domestic
- RBI Maintains Status Quo: Repo rate unchanged at 5.25%, FY26 GDP forecast raised to 7.4%
- Budget 2026 Impact: STT changes in F&O, fiscal deficit target at 4.3% for FY27
- REIT Lending Allowed: Banks permitted to lend to REITs
- India-EU FTA Signed: Tariff elimination on ~90% exports
- IIP Surge: December IIP at 7.8%
- Inflation Edges Up: CPI at 1.33%
Global
- US Tech Sell-off: Nasdaq corrected over 1.5% amid AI capex concerns
Indian Stock Market Last Week Graph – What It Shows
The Indian stock market last week graph reflects:
- Strong defense near 25,600
- Range-bound consolidation below 26,000
- Cooling volatility and expiry pinning behavior
This pattern suggests a build-up phase before a potential breakout or breakdown.
Weekly Market Structure – Technical Summary
Final Weekly Market Outlook
This weekly market report confirms that the stock market weekly structure remains stable and range-bound.
The Indian stock market last week graph clearly shows consolidation near critical levels, with 26,000 acting as the next major trigger for momentum expansion.
FAQs
1. How did the weekly market perform this week?
The weekly market closed in the green, with Nifty gaining 1.42%, supported by consolidation above 25,600.
2. What does the Indian stock market last week graph indicate?
It indicates range-bound consolidation with strong support near 25,500 and resistance near 26,000.
3. Is the weekly stock market trend bullish?
The short-term weekly stock market trend is neutral-bullish as long as Nifty sustains above 25,600.
4. What does PCR of 0.90 indicate?
A PCR of 0.90 suggests balanced sentiment with slight caution, as call writers maintain some control.
5. Why is low India VIX important?
A low India VIX signals reduced fear but may also indicate complacency before volatility spikes.
Disclaimer: This report is for informational purposes only and does not constitute financial advice. Please consult your financial advisor before making any investment decisions.
Happy Trading!
The Firstock Team