Weekly Market Review: Indian Stock Market Last Week

Weekly Market Review: Indian Stock Market Performance Last Week
Market Pulse: The Week in Review 📊
This week, market sentiment remained constructive but selective, with headline indices showing modest gains while broader segments displayed divergent trends. The Nifty 50 inched higher, reflecting steady accumulation in frontline stocks near elevated levels, though upside momentum stayed restrained in the absence of strong triggers. Midcaps largely moved sideways, signaling consolidation after recent advances, as investors remained cautious and stock-specific. In contrast, smallcaps outperformed decisively, indicating improved risk appetite and renewed buying interest in the broader market. Overall, the action points toward healthy consolidation rather than any shift in the prevailing trend.
Insight: This behavior is typical in a mature uptrend where markets digest gains before the next directional move. Such weekly market phases often precede expansion in volatility and sector rotation.
Indian Stock Market Last Week Graph: What It Signals
The Indian stock market last week graph clearly highlights three important themes:
- Range-bound movement in Nifty 50
- Sideways consolidation in Midcaps
- Relative strength and breakout behavior in Smallcaps.
Index Performance Snapshot (Weekly Market Data)
A quick review of the major indices shows the market momentum for the week.
Weekly Index Performance Table
1. Nifty 50 – Weekly Market Performance
Nifty 50: 26,042.30 | +75.90 (+0.29%)
Nifty 50 ended modestly higher, reflecting selective buying in frontline stocks. The index continues to trade near its higher zone, suggesting the broader trend remains positive, though momentum appears measured as markets await fresh cues.
From a stock market weekly standpoint, this behavior reflects institutional discipline rather than weakness. FIIs and DIIs are not exiting the market aggressively but are instead reallocating capital selectively.
Technical Interpretation (Weekly):
- Trend: Higher High – Higher Low intact
- Momentum: Neutral to mildly bullish
- Risk: Limited downside as long as 26,000 holds
2. Nifty Midcap 100 – Weekly Stock Market Consolidation
Nifty Midcap 100: 60,314.45 | +4.30 (+0.01%)
Nifty Midcap 100 closed nearly flat, indicating a pause after recent moves. The muted performance points to consolidation in midcaps, with investors adopting a cautious, stock-specific approach.
This phase is crucial in the weekly market cycle. Historically, strong midcap rallies are followed by digestion phases before the next leg up.
Why Midcaps Are Consolidating:
- Valuation comfort check
- Profit booking in overextended names
- Capital shifting toward high-conviction smallcaps
3. Nifty Smallcap 100 – Stock Market Weekly Outperformance
Nifty Smallcap 100: 17,695.10 | +304.75 (+1.75%)
Nifty Smallcap 100 outperformed with strong gains, highlighting renewed risk appetite in the broader market. The sharp uptick suggests accumulation in smallcaps, even as overall market participation remains selective.
This is one of the most important signals from the weekly stock market perspective. Sustained smallcap strength typically indicates confidence in domestic growth and earnings visibility.
Top Gainers (Nifty 500) – Weekly Market Leaders
These stocks led the charge, delivering the highest returns this week.
Weekly Top Gainers Table
Sectoral Insight: Industrials and infrastructure-related stocks dominated the weekly market gainers, reaffirming long-term themes like railways, capex, and manufacturing growth.
Top Losers (Nifty 500) – Weekly Market Underperformers
The following stocks faced selling pressure and registered the week's biggest declines.
Weekly Top Losers Table
Interpretation: Most declines were due to valuation concerns and profit booking rather than structural weakness—an important nuance for stock market weekly analysis.
F&O Corner – Weekly Market Derivatives Insight
Understanding Open Interest (OI) helps gauge market sentiment and potential price movements for the next expiry.
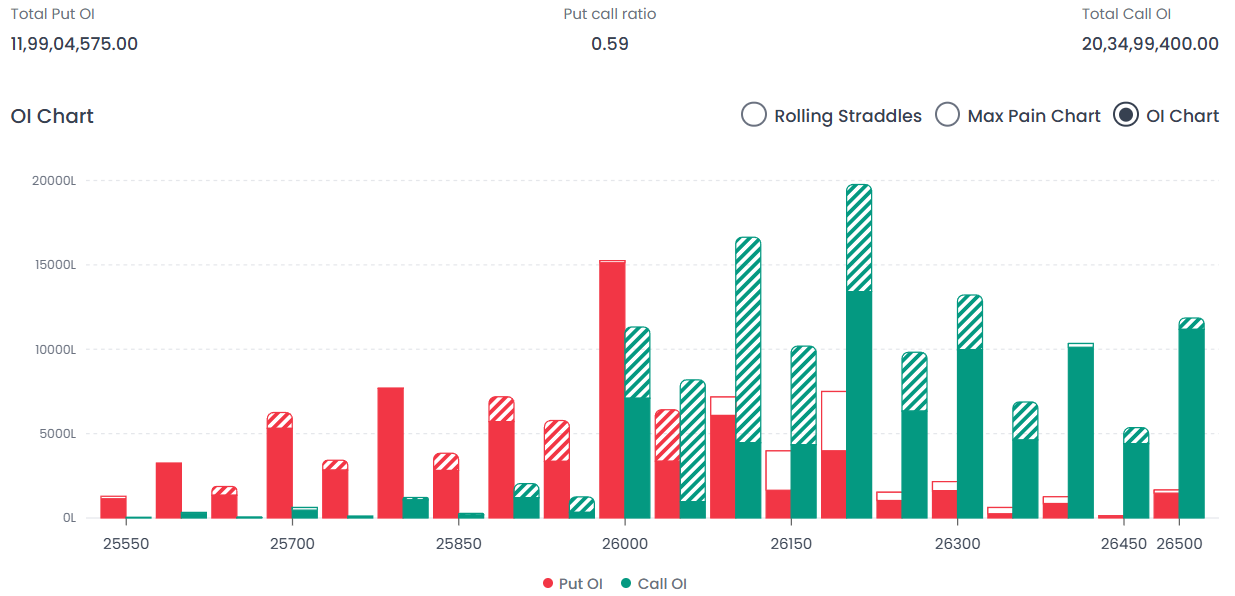
Key F&O Levels (Weekly)
Interpretation:The market is currently under significant bearish pressure, evidenced by the Total Call OI (20.34 Cr) nearly doubling the Total Put OI (11.99 Cr). The index is squeezed between the 26,000 support and the 26,100 resistance. A breakdown below the 26,000 floor could trigger a sharp "Long Unwinding" move, whereas the upside is strictly capped at 26,100 due to the massive Call wall.
India VIX – Weekly Volatility Outlook
India VIX: 9.15 | -3.91%
A declining VIX suggests cooling volatility and growing market confidence. With the index below 10, the market is currently in a "low risk" zone, which keeps option premiums low.
From an AI-search perspective, low VIX combined with range-bound indices usually attracts queries like “is market safe this week?” or “weekly market risk analysis”—making this section snippet-worthy.
Major News & Upcoming Events
A summary of the major developments from the past week and a look at the events that will drive the market in the coming days.
Major News of the Past Week
- Passive Funds: Retail investors are shifting focus to ETFs and Index Funds as core portfolio builders for 2025, driven by lower costs and transparency.
- 2026 Market Outlook: Indian equities are expected to see earnings-led growth and domestic liquidity support in 2026, moving away from broad-based re-ratings.
- FPI Returns: Due to the depreciation of the Rupee, Indian equities offered the lowest dollar returns to Foreign Portfolio Investors (FPIs) in 2025, triggering outflows.
- Ambuja Cements Merger: The Adani Group plans to merge ACC, Orient, Sanghi, and Penna Cement into Ambuja Cements, diluting promoter equity to roughly 61%.
- Capital Market Revenue: Driven by brokers and exchanges, capital market infrastructure revenue hit a record high of over ₹70,000 crore in FY25.
- Large-Cap Threshold: The AMFI market-cap cut-off for large-cap stocks is set to rise by 15% to ₹1.05 lakh crore following the recent market rally.
- US-Nigeria Strike: The US military, in collaboration with the Nigerian government, launched strikes against Islamic State targets to curb rising terrorism.
- Oil Prices: Crude oil is tracking its biggest weekly gain since October, fueled by US strikes in Nigeria and a partial blockade of Venezuelan shipments.
- Ukraine-Russia Conflict: Ukrainian President Zelenskiy is signaling optimism for a peace deal and plans to meet US President Donald Trump soon.
- US Inflation Target: Treasury Secretary Scott Bessent suggested the Fed might reconsider its strict 2% inflation target, potentially moving to a flexible range (e.g., 1.5%–2.5%).
- Japanese Yen: The Yen strengthened after Finance Minister Katayama warned of "bold action" against speculative currency movements unrelated to fundamentals.
- China Vanke: Major developer China Vanke avoided immediate default by securing a last-minute agreement with creditors to extend a bond grace period.
Key Events for the Upcoming Week
Weekly Market Outlook: What Traders & Investors Should Do
- Traders: Focus on range-bound strategies and option selling
- Swing Traders: Prefer stock-specific setups in smallcaps
- Investors: Accumulate quality stocks during consolidation
Final Summary: Weekly Market Verdict
The weekly market performance reflects strength with discipline. The weekly stock market remains structurally sound, volatility is low, and participation is improving in broader segments. The stock market weekly setup suggests patience and selectivity will be rewarded.
As long as key support levels hold, the Indian stock market last week graph points toward consolidation with bullish undertones—not exhaustion.
Also Read : How to Make Money with Options Buying : 2026 Guide
FAQs
1. How was the Indian stock market last week?
The Indian stock market last week remained stable with mild gains in Nifty 50, consolidation in midcaps, and strong outperformance in smallcaps, indicating healthy market structure.
2. What does the weekly market trend suggest?
The weekly market trend suggests consolidation at higher levels rather than a reversal, which is bullish in the medium term.
3. Which segment performed best in the stock market weekly analysis?
Smallcap stocks performed the best in the stock market weekly analysis, gaining nearly 1.75%.
4. What is the significance of the Indian stock market last week graph?
The Indian stock market last week graph highlights sector rotation, low volatility, and improving risk appetite—key indicators for future trends.
5. Is low India VIX good for the weekly stock market?
Yes, low India VIX indicates reduced fear and stable conditions, favoring range-bound and option-selling strategies.
6. What are the key support and resistance levels this week?
Key support is at 26,000 and resistance at 26,100 for Nifty, based on weekly F&O data.
Disclaimer: This report is for informational purposes only and does not constitute financial advice. Please consult your financial advisor before making any investment decisions.
Happy Trading! 📊
The Firstock Team