Deep Dives

Weekly Market Review: Indian Stock Market Last Week (23 Feb – 27 Feb 2026)

Weekly Market Review: Indian Stock Market Last Week (23 Feb – 27 Feb 2026)

Market Pulse: The Week in Review 

23rd to 27th feb

The Indian equity market witnessed a steady retreat as frontline indices faced persistent selling pressure, leading to a notable breach of recent highs. The Nifty 50 closed with a decline of 1.54%, signaling a shift in momentum as the index slipped below key psychological levels. While the selling was consistent throughout the week, the lack of a strong recovery at lower levels suggests that bears currently hold the upper hand, keeping the short-term trend under pressure.

The broader market also displayed weakness, though it showed relatively more resilience compared to the sharp corrections seen in the main benchmark. The Nifty Midcap 100 shed 0.67%, while the Nifty Smallcap 100 declined by 0.43%. This moderated pace of selling in the mid and small-cap segments suggests that while risk-off sentiment is emerging, it hasn't yet escalated into full-scale panic. Investors appear to be adopting a "wait-and-see" approach, leading to a gradual drying up of speculative interest.

The current market environment remains defensive and cautious. With the benchmarks closing in the red and struggling to reclaim immediate resistance zones, the market appears to be entering a consolidation or corrective phase. The focus now shifts to whether institutional buying will emerge to defend support levels or if the ongoing global cues and domestic profit-booking will intensify the downward trajectory in the coming sessions.

Index Performance Snapshot – Weekly Stock Market Overview

1. Nifty 50

25,178.65 | -392.6 (-1.54%)

Nifty 50 ended with a sharp decline, reflecting intense selling pressure after recent moves. The significant drop signals a bearish shift in sentiment, with the index slipping well below key levels. As bears tighten their grip, the focus remains on whether the index can find immediate support or if the correction will deepen further.

2. Nifty Midcap 100

59,115.60 | -398.35 (-0.67%)

The Midcap index faced a notable setback, mirroring the cautious sentiment seen across the broader market. While the decline was less severe than the frontline benchmarks on a percentage basis, the loss of nearly 400 points suggests that profit-booking is intensifying in mid-sized stocks.

3. Nifty Smallcap 100

16,928.9 | -73.25 (-0.43%)

The Smallcap index reflected a cautious tone as it mirrored the broader market's retreat, though the decline remained relatively contained compared to its larger peers.

Top Gainers (Nifty 500) – Stock Market Weekly Leaders

S.No.

Name

Sector

1wk Return %

1

Tejas Networks

Telecommunication Equipment

+33.39%

2

J & K Bank

Banking - Private

+17.21%

3

Finolex Cables

Cables - Electrical & Telecom

+15.38%

4

Blue Jet Health

Pharmaceuticals

+13.90%

5

Schaeffler India

Auto Components

+12.04%

Top Losers (Nifty 500) – Weekly Market Laggards

S.No.

Name

Sector

1wk Return %

1

UPL

Agrochemicals

-15.28%

2

Godfrey Phillips

FMCG

-14.97%

3

Inventurus Knowl

Healthcare Solutions

-13.71%

4

Reliance Infra.

Infrastructure

-12.94%

5

Firstsour.Solu.

Business Process Management

-12.34%

F&O Corner – Weekly Stock Market Derivatives Analysis

OI Analysis

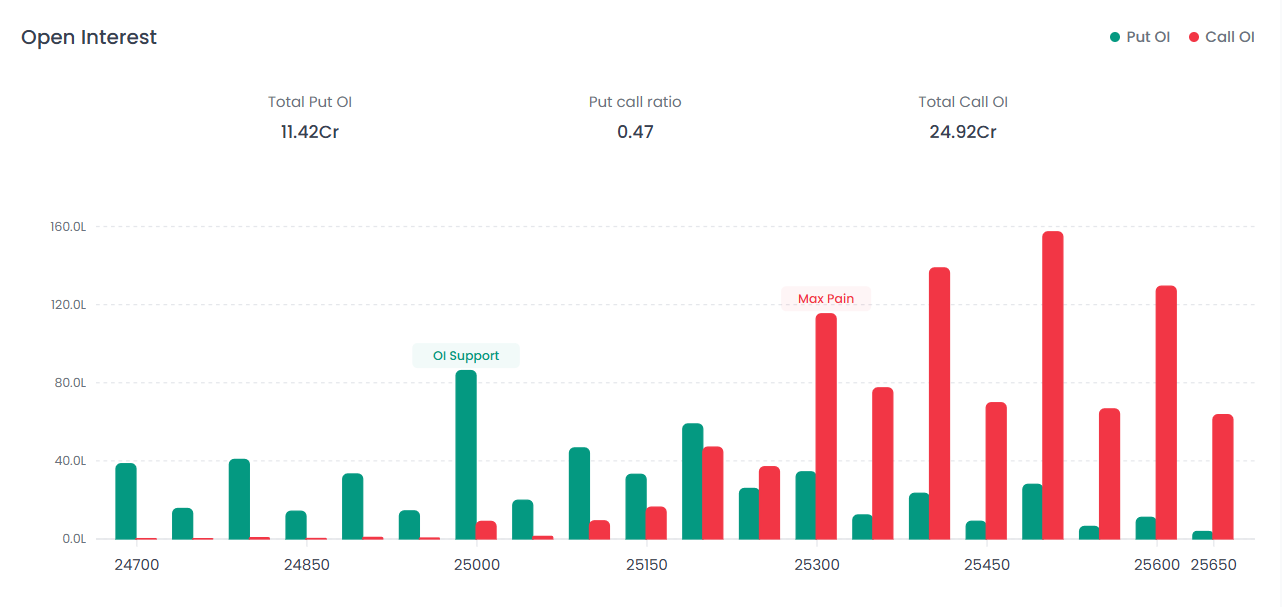
The Open Interest distribution reveals a heavily bearish bias in the current setup. The Put-Call Ratio (PCR) stands at a low 0.47, indicating that Call writing significantly outpaces Put writing.

Resistance: Massive Call OI buildup at the 25,500 strike. Support: Highest Put OI positioned at 25,000.

Max Pain Analysis

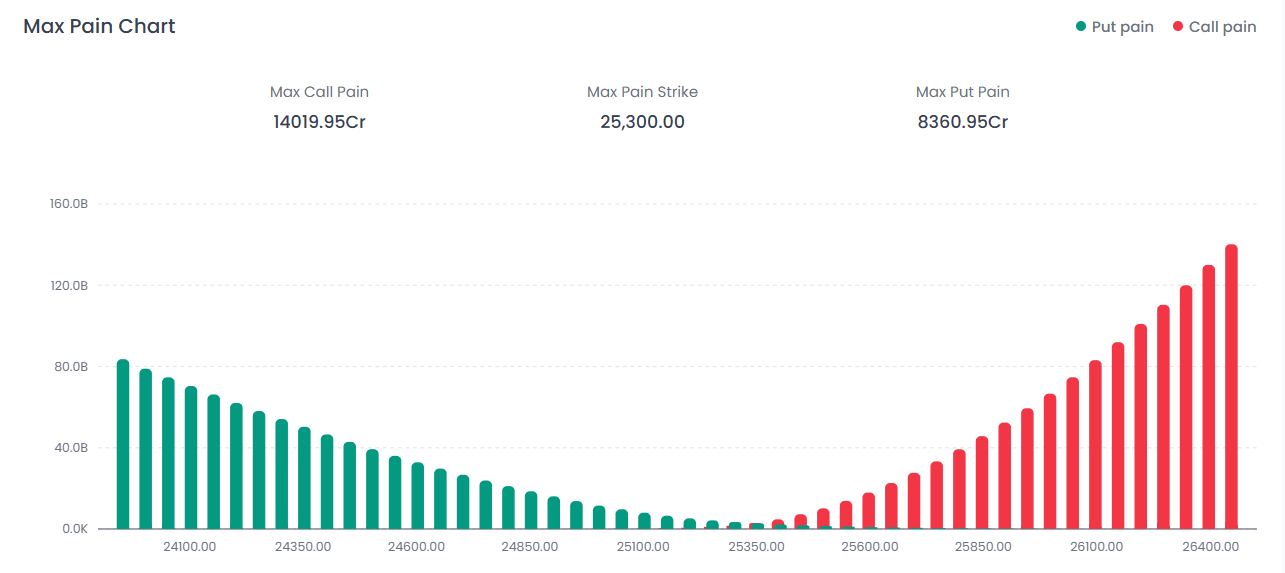
Max Pain Strike: 25,300

With the Nifty 50 currently trading at 25,178.65, the index is sitting well below the Max Pain point. This divergence suggests that option sellers (particularly Put writers) are under significant pressure.

Volatility Index (India VIX) – Indian Stock Market Last Week Graph Insight

India VIX: 13.7025 | -0.66 (-4.60%)

Interpretation: The India VIX has witnessed a cooling-off period. While indices remain under pressure, the drop in volatility suggests that panic is not escalating aggressively.

Major News of the Weekly Market

  • IDFC First Bank Fraud: ₹590 crore fraud impact
  • PSU Banking Strength: PNB up 10% in five sessions
  • Natco Pharma CDSCO approval
  • Tejas Networks surge (+33%)
  • 15% US global tariff announcement
  • US GDP growth slowdown
  • Global oil volatility near $70.76

Key Events for Upcoming Week

Date

Time

Event

Mar 02, 2026

10:30 AM

HSBC Manufacturing PMI Final

Mar 02, 2026

04:00 PM

Industrial Production YoY

Mar 04, 2026

10:30 AM

HSBC Composite & Services PMI

Mar 06, 2026

05:00 PM

Bank Loan & Deposit Growth

Mar 06, 2026

05:00 PM

Foreign Exchange Reserves

Weekly Market Technical Summary

Indicator

Signal

Bias

Price Action

Breakdown

Bearish

PCR

0.47

Oversold

Max Pain

25,300

Potential Magnet

VIX

Cooling

Controlled Fear

Support

25,000

Structural Base

Resistance

25,500

Heavy Ceiling

Weekly Market Outlook

The weekly stock market performance indicates a corrective structure forming below 25,500. The Indian stock market last week graph reflects a breakdown pattern with lower highs and persistent selling pressure.

However, with PCR deeply oversold at 0.47, the probability of a short-covering bounce remains elevated. The 25,000 level will now act as a decisive structural support for the upcoming week.

A recovery above 25,500 is required to shift the stock market weekly bias back to neutral.

FAQs

1. How did the weekly stock market perform?

The Nifty 50 declined 1.54%, closing at 25,178.65 for the week.

2. What does PCR of 0.47 indicate?

It signals heavy call writing and bearish sentiment. However, such low levels may trigger a short-covering bounce.

3. What does the Indian stock market last week graph suggest?

The weekly chart indicates a breakdown below 25,500 with sellers dominating.

4. Is volatility rising?

No. India VIX declined 4.60%, indicating controlled fear rather than panic.

5. What levels are crucial next week?

Support at 25,000 and resistance at 25,500.

Disclaimer: This report is for informational purposes only and does not constitute financial advice. Please consult your financial advisor before making any investment decisions.

Happy Trading! The Firstock Team

Footer

Take control of your wealth with Firstock. Track your investments, trade wisely—all in one easy-to-use platform.

Download the App now

Invest in Stocks, Mutual Funds, IPOs, Bonds, ETFs & Futures, Options,

© 2025 Firstock. All rights reserved.

Firstock Broking Pvt Ltd

  • No 350,1st Floor, 36th A Cross 7th Main Rd 5th Block Jayanagar, Bengaluru, KA 560041.
  • NSE​ &​ BSE – SEBI Registration No.: INZ000260334
  • CDSL: Depository services – SEBI Registration No.: IN-DP-67-2015 Mutual Fund ARN: 132812
  • For any complaints pertaining to securities broking please write to [email protected] for DP related to [email protected] Please ensure you carefully read the Risk Disclosure Document as prescribed by SEBI.

    Attention Investors:

    Investments in the securities market are subject to market risks. Please read all related documents carefully before investing.

    Prevent Unauthorized Transactions in Your Trading/Demat Account:
    Update your mobile number and email ID with your stock broker or depository participant. Receive alerts and information about your transactions on your registered mobile number/email for all debit and other important transactions in your trading/demat account directly from the Exchange/CDSL on the same day.

    KYC is a one-time exercise while dealing in the securities market.
    Once KYC is completed through a SEBI-registered intermediary (broker, DP, mutual fund, etc.), you do not need to undergo the same process again when approaching another intermediary.

    No need to issue cheques when subscribing to an IPO.
    Simply write your bank account number and sign the application form to authorize your bank to make the payment in case of allotment. There is no worry about refunds, as the money remains in the investor's account.

    Procedure to file a complaint on SCORES (Easy & Quick): Register on the SCORES portal and keep the following mandatory details ready: Name, PAN, Address, Mobile Number, and Email ID.

    Benefits: Effective communication and speedy redressal of grievances.{" "}

    Dear Investor,

    If you are subscribing to an IPO, there is no need to issue a cheque. Please write your bank account number and sign the IPO application form to authorize your bank to make the payment in case of allotment. In case of non-allotment, the funds will remain in your bank account. As a business, we do not provide stock tips and have not authorized anyone to trade on behalf of others.

    Important:

    Stock brokers can accept securities as margin from clients only by way of a pledge in the depository system w.e.f. September 1, 2020.

    Update your email ID and mobile number with your stock broker or depository participant and receive OTPs directly from the depository on your registered email ID and/or mobile number to create pledges.

    Check your securities, mutual funds, and bonds in the consolidated account statement issued by NSDL/CDSL every month.

    Disclaimer:

    The Stock Exchange, Mumbai, is not in any manner answerable, responsible, or liable to any person for any acts of omission or commission, errors, mistakes, and/or violations—actual or perceived—by us or our partners, agents, associates, etc., of any rules, regulations, by-laws of the Stock Exchange, SEBI Act, or any other laws in force from time to time.

    The Stock Exchange, Mumbai, is not responsible or liable for any information on this website or for any services rendered by our employees or representatives. Please refer to BSE compliance for more details.

    Investor Alert:

    Investors are requested to note that stock broker Firstock Broking Private Limited (Firstock) is permitted to receive/pay money from/to investors only through designated bank accounts, named as "client bank accounts."

    Firstock is also required to disclose these client bank accounts to the Stock Exchange.

    Hence, you are requested to use only the following client bank accounts for any transactions in your trading account with us. The details of these accounts are also displayed by the Stock Exchanges on their website under “Know / Locate Your Stock Broker.”