Weekly Market Review: Indian Stock Market Last Week(27Jan – 30 Jan 2026)

Market Pulse: The Week in Review
The Indian equity market witnessed a robust recovery, with frontline indices reclaiming ground as buyers stepped in at lower levels. Nifty 50 closed with a solid gain of 1.09%, signaling a resilient bounce-back in momentum as the index successfully defended and moved back above key psychological levels. The emergence of buying interest indicates a shift in the short-term trend, with bulls reclaiming control following the recent consolidation phase.
The broader market displayed significant strength, substantially outperforming the benchmarks. Nifty Midcap 100 surged 2.25%, while Nifty Smallcap 100 climbed 3.22%. Unlike the weakness seen in previous sessions, this aggressive accumulation indicates that confidence has been restored, with speculative interest returning as risk-on sentiment takes center stage.
The session points to a constructive and optimistic environment across the market. With the index closing deep in the green and reclaiming major support zones, the market is likely to move out of its corrective phase, with the focus now shifting to whether the bulls can sustain these higher levels or if the upward momentum will intensify further.
Index Performance Snapshot
A quick review of the major indices shows the market momentum for the week.
1. Nifty 50
25,320.65 | +272 (+1.09%)
Nifty 50 ended with a steady advance, reflecting sustained buying interest following recent consolidation. This gain signals a bullish shift in sentiment, with the index reclaiming and holding above key psychological levels. As bulls strengthen their position, the focus remains on whether the index can maintain this momentum to challenge new highs or if it will face overhead resistance.
2. Nifty Midcap 100
58,432 | +1,286.35 (+2.25%)
The Midcap index witnessed a robust recovery, significantly outperforming the frontline benchmark. This sharp climb indicates that risk appetite has returned, leading to healthy accumulation across broader pockets. The index stabilized convincingly, suggesting that buyers are once again looking for value and that the previous cautiousness is giving way to a renewed uptrend.
3. Nifty Smallcap 100
16,879.10 | +526.35 (+3.22%)
Smallcaps led the charge in the market rebound, registering the steepest gain among the three indices. This strong surge of over 3% signals a complete risk-on sentiment, with aggressive buying seen in high-beta stocks. The severity of the upward move indicates that confidence in the broader market has been significantly restored, with speculative interest and retail participation picking up momentum.
Top Gainers (Nifty 500)
Top Losers (Nifty 500)
F&O Corner
OI Analysis
Understanding Open Interest (OI) helps gauge market sentiment and potential price movements for the next expiry.
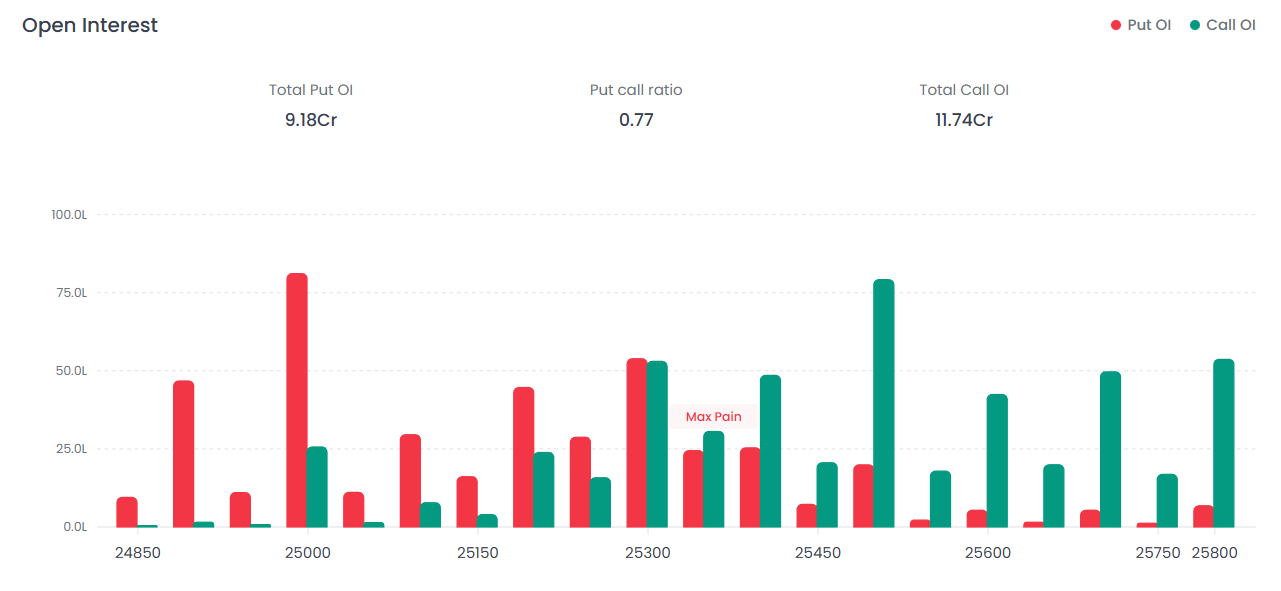
Near Resistance for the Week: 25,500 Call OI is dominant here with the tallest green bar on the chart. Significant Call writing has created a massive "Ceiling" at this level, indicating traders do not expect the market to cross this zone easily.
Near Support for the Week: 25,000 The highest Put OI is observed at this strike, indicated by the tall red bar. This serves as the primary "Floor" or safety net where buyers are likely to step in.
Put Call Ratio (PCR): 0.77 | Current Scenario: BEARISH A PCR below 1.0 indicates aggressive Call writing.
Interpretation: The market continues to exhibit bearish sentiment, evidenced by the Total Call OI (11.74 Cr) significantly outpacing the Total Put OI (9.18 Cr). The index is facing immediate pressure, leading up to a stiff resistance wall at 25,500. On the downside, the first major line of defense for the bulls remains at 25,000. The PCR of 0.77 confirms that Call writers remain confident, suggesting that any upside momentum is likely to be met with fresh selling unless the resistance at 25,500 is decisively broken.
Max Pain Analysis
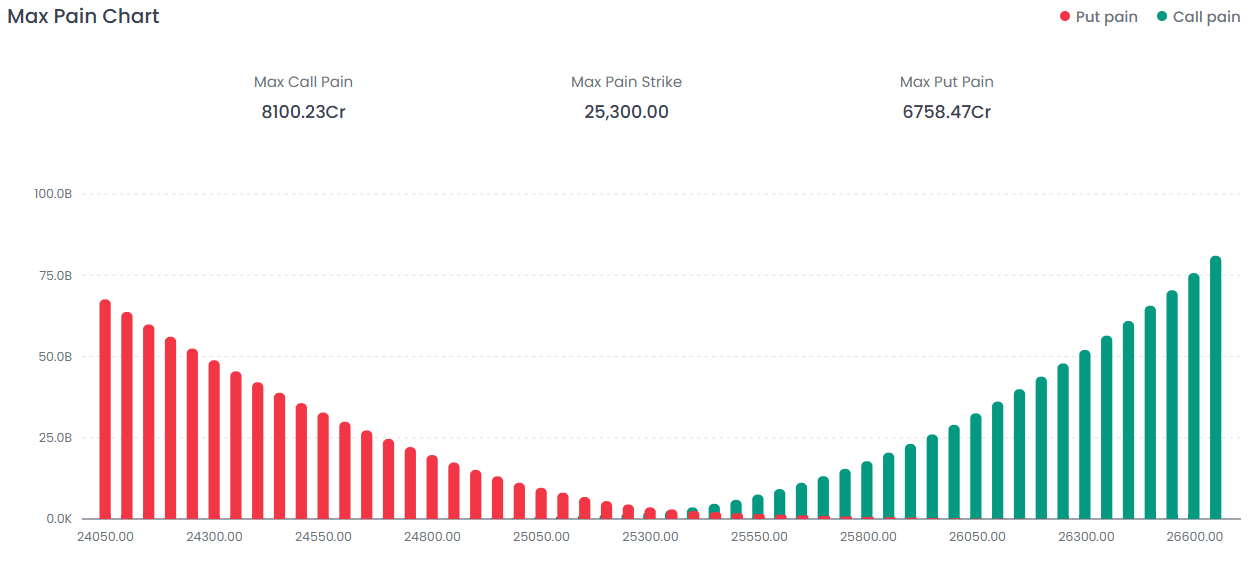
Interpretation: The Max Pain level is currently positioned at 25,300.00, which acts as a pivotal point for the expiry.
The "Magnet" Effect: The market often gravitates toward this level by expiry to inflict the least amount of loss on Option Writers (smart money). This suggests a potential tendency for the index to attempt a move toward 25,300.
Conflict with Trend: While the price may fluctuate, the current Max Pain Strike of 25,300 aligns with a high concentration of both Call and Put OI. This indicates that option writers are positioning for an expiry centered around this strike, though the significantly higher Max Call Pain (8100.23Cr) compared to Max Put Pain (6758.47Cr) reinforces the overarching bearish pressure on the market.
Volatility Index (India VIX)
The 'Fear Index' reflects the market's expectation of volatility.
India VIX: 13.63 | -0.56 (-3.95%)
Interpretation: The India VIX has registered a notable cooling, dropping to 13.63 with a decline of -3.95%. This movement suggests a return toward market stability and a decrease in immediate perceived risk. This contraction in volatility contributes to a softening in option premiums (Vega compression), reflecting a slight increase in trader complacency compared to previous sessions.
Major News & Upcoming Events
Major News of the Week
- Bank Strike on January 27
- Central tax collections weak in FY26
- India–EU Free Trade Agreement signed
- IIP growth surged to 7.8%
- Commodity rally in gold, copper, silver
- US tech firms boosting AI spending
- Fed chair speculation strengthened dollar
- Copper volatility due to stronger greenback
- Government shutdown averted in US
- Eurozone growth beat expectations
Key Events for the Upcoming Week
Indian Stock Market Last Week Graph – What the Rally Signals
The Indian stock market last week graph reflects a classic V-shaped rebound:
- Strong recovery from support zones
- Broad-based participation
- Midcap & smallcap leadership
- Declining volatility
Such setups often mark the early stage of a momentum continuation phase, provided resistance levels are decisively breached.
Weekly Market Structure Summary
Sectoral Momentum Snapshot
Final Weekly Market Outlook
This weekly stock market report highlights a decisive rebound in the Indian equity market. The combination of strong price action, broader market participation, and cooling volatility signals a constructive backdrop heading into a crucial macro-heavy week featuring the Union Budget and RBI policy decision.
If bulls sustain momentum above resistance, the next phase could transition from recovery to trend acceleration.
FAQs
1. What happened in the Indian weekly stock market this week?
The Indian weekly stock market saw a strong recovery. Nifty gained 1.09%, midcaps rose 2.25%, and smallcaps surged 3.22%, indicating a clear shift toward risk-on sentiment.
2. What does the Indian stock market last week graph indicate?
It indicates a bullish rebound from support levels with strong participation from broader markets, suggesting improving momentum.
3. Is the weekly market trend bullish or bearish?
Price action is bullish, but derivatives data (PCR below 1) indicates resistance overhead. A breakout above 25,500 would confirm stronger bullish momentum.
4. Why did smallcaps outperform this week?
Smallcaps outperformed due to renewed risk appetite and aggressive buying in high-beta stocks during the recovery phase.
5. How does India VIX affect weekly trading?
A falling India VIX reduces option premiums and indicates improving market stability, often supporting bullish continuation.
6. What are the most important levels for next week?
Resistance: 25,500 Support: 25,000 Max Pain: 25,300
Disclaimer: This report is for informational purposes only and does not constitute financial advice. Please consult your financial advisor before making any investment decisions.
Happy Trading!
The Firstock Team