Weekly Market Review: Indian Stock Market Last Week (29 Dec 2025 – 2 Jan 2026)

Weekly Market Review: Indian Stock Market Performance Last Week
Market Pulse: The Week in Review 📊
This week, market momentum strengthened meaningfully, with gains broadening beyond select pockets and participation improving across segments. The headline indices posted healthy advances, reflecting renewed confidence and sustained buying interest. The Nifty 50 delivered a strong performance, rising over 1% for the week as frontline stocks saw broad-based accumulation. The index has decisively moved into a higher zone, reinforcing the prevailing bullish undertone, though near-term progress may remain gradual at elevated levels. Midcaps emerged as clear outperformers, with the Nifty Midcap 100 rallying close to 1.75%. The sharp upmove highlights improving risk appetite and widespread buying interest, while the index continues to trade firmly, supporting a positive near-term structure. Smallcaps also ended higher, with the Nifty Smallcap 100 gaining around 0.8%. Although the pace of gains was relatively measured, the index remains in a constructive zone, indicating steady participation and underlying support in the broader market.
pasted
From a weekly market standpoint, this phase represents a shift from selective leadership to broader-based participation—an important hallmark of trend strength rather than late-stage exuberance.
Indian Stock Market Last Week Graph: Structural Interpretation
The Indian stock market last week graph clearly reflects strengthening breadth across market segments:
- Large-cap indices breaking into higher zones
- Midcaps acting as momentum leaders
- Smallcaps maintaining constructive stability
Such alignment across capitalizations historically improves trend sustainability and enhances confidence among long-term investors and swing traders alike.
Index Performance Snapshot – Weekly Stock Market Overview
A quick review of the major indices shows the market momentum for the week.
📊 Weekly Index Performance Table
Nifty 50 – Weekly Market Performance Analysis
Nifty 50: 26,328.55 | +286.25 (+1.10%)
Nifty 50 surged sharply to close at 26,328.55, posting strong gains of over 1%, driven by broad-based buying in frontline stocks. The index has moved decisively into its higher zone, reinforcing the positive underlying trend, with sentiment improving on the back of sustained momentum.
From a stock market weekly structure perspective:
- Institutional participation remains strong
- Dips are being absorbed quickly
- Trend structure remains intact above key supports
This reinforces the view that the weekly market is in an expansionary phase rather than a distribution phase.
Nifty Midcap 100 – Weekly Stock Market Leadership
Nifty Midcap 100: 61,365.90 | +1,051.45 (+1.74%)
Nifty Midcap 100 registered a strong rally, closing at 61,365.90 with gains of nearly 1.75%. The sharp upmove reflects broad-based buying across midcap stocks, indicating improving risk appetite, while the index continues to trade in a firm zone, supporting a positive near-term outlook.
Midcap leadership in a weekly stock market trend often signals:
- Improved earnings confidence
- Greater domestic participation
- Early-stage trend continuation rather than exhaustion
Nifty Smallcap 100 – Weekly Market Participation
Nifty Smallcap 100: 17,832.05 | +136.95 (+0.77%)
Nifty Smallcap 100 ended higher at 17,832.05, gaining close to 0.8%, supported by selective buying across smallcap stocks. The index remains in a constructive zone, suggesting steady participation, though the pace of gains appears more measured compared to the broader market.
This controlled behavior supports overall weekly market stability, avoiding speculative excess.
Top Gainers (Nifty 500) – Weekly Market Leaders
These stocks led the charge, delivering the highest returns this week.
📈 Weekly Top Gainers Table
Sectoral leadership from Industrials and cyclicals strengthens the stock market weekly growth narrative.
Top Losers (Nifty 500) – Weekly Market Pressure Areas
The following stocks faced selling pressure and registered the week's biggest declines.
📉 Weekly Top Losers Table
These declines were largely event-driven, not trend-breaking—an important distinction for weekly market interpretation.
F&O Corner – Weekly Market Derivatives Analysis
Understanding Open Interest (OI) helps gauge market sentiment and potential price movements for the next expiry.
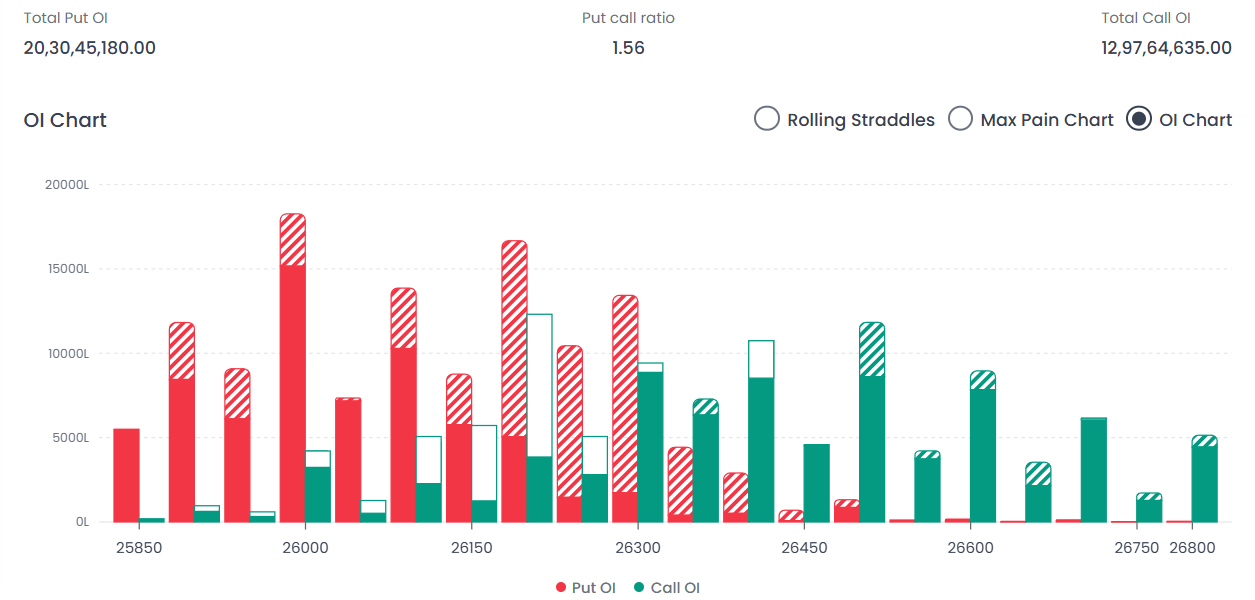
📊 Weekly F&O Levels Table
Interpretation:The market is currently showing strong bullish sentiment, evidenced by the Total Put OI (20.30 Cr) significantly exceeding the Total Call OI (12.97 Cr). The index is well-supported with a strong base at 26,000 and intermediate support at 26,100. The immediate hurdle is at 26,300, but the real test for the bulls lies at 26,500. The high PCR suggests that dips near support levels are likely to be bought into, provided the 26,000 floor remains intact.
India VIX – Weekly Volatility Index Insight
India VIX: 9.45 | +0.3 (+3.28%)
Despite a modest uptick, India VIX remains at historically subdued levels. This reflects:
- Low fear environment
- Continued confidence in trend stability
- Favorable conditions for option sellers
From a weekly stock market standpoint, low volatility supports a “buy-on-dips” structure rather than panic-driven corrections.
Major News & Developments Impacting the Weekly Market
Key News of the Past Week
- Cigarette stocks under pressure following additional taxes
- SEBI considering deferral of higher OTR penalties
- IPO fundraising hits record ₹1.76 lakh crore in 2025
- Gold and silver extend strongest annual run since 1979
- Brent crude slips below $61/barrel
- US Fed signals conditional rate cuts
- China reiterates 5% GDP growth target
Each of these developments influenced sector-specific movement without altering the broader weekly market trend.
Key Events to Watch – Upcoming Week
📅 Economic Calendar Table
Weekly Market Outlook: Strategic Guidance
- Traders: Buy-on-dips near support zones
- Options Traders: Credit strategies favored
- Investors: Stay allocated to midcap leaders
Final Verdict: Weekly Market Summary
The weekly market reflects expanding participation, rising confidence, and improving breadth. The weekly stock market structure remains bullish with strong derivatives support and low volatility. The stock market weekly setup favors continuation as long as key support levels hold.
Also Read : Career in Stock Market in India: Jobs, Salary & Growth In 2026
FAQs
1. How was the Indian stock market last week?
The Indian stock market last week posted strong gains, with Nifty 50 rising over 1%, midcaps outperforming, and smallcaps remaining constructive.
2. What does the weekly market trend indicate?
The weekly market trend indicates strong bullish momentum supported by broad participation and favorable derivatives positioning.
3. Which index performed best in the stock market weekly review?
Nifty Midcap 100 was the top performer, gaining nearly 1.75% for the week.
4. What does the Indian stock market last week graph show?
The Indian stock market last week graph shows synchronized strength across large, mid, and smallcap stocks, signaling trend continuation.
5. Is low India VIX positive for the weekly stock market?
Yes, low India VIX suggests reduced fear and stable conditions, supporting a buy-on-dips market structure.
6. What are the key support and resistance levels?
Key support lies at 26,000 while resistance is placed near 26,500 based on weekly F&O data.
Happy Trading!
The Firstock Team