Weekly Market Review: Indian Stock Market Last Week(5 Jan – 9 Jan 2026)

Why This Weekly Market Report Matters
This weekly stock market report is designed for:
- Active traders
- Positional & swing traders
- Options traders
- Long-term investors tracking trend shifts
- Readers searching for Indian stock market last week graph and weekly insights
It combines price action, derivatives data, volatility, macro news, and event-based triggers in one place—making it highly valuable for humans and search engines alike.
Market Pulse: The Week in Review 📊
The Indian equity market witnessed a sharp risk-off session, with frontline as well as broader indices ending deep in the red. Nifty 50 fell 2.45%, signaling heavy profit-booking after the recent rally and a clear break from its short-term consolidation phase. The move reflects rising caution among investors amid the absence of positive triggers.
The weakness was even more pronounced in the broader market. Nifty Midcap 100 declined 2.64%, while Nifty Smallcap 100 plunged 3.08%, indicating aggressive unwinding in high-beta and speculative stocks. This underperformance of mid and smallcaps highlights a shift toward capital preservation and a temporary risk-off environment.
The session points to a short-term corrective phase across the market. While the medium-term structure remains intact, the current sell-off suggests that markets may look to consolidate or test key support levels before attempting the next directional move.
Index Performance Snapshot
A quick review of the major indices shows the market momentum for the week.
1. Nifty 50
25,683.3 | -645.25 (-2.45%)
Nifty 50 ended sharply lower, reflecting broad-based profit-booking after recent highs. The decline suggests a shift into a corrective phase, though the medium-term trend remains positive as long as key support levels hold.
2. Nifty Midcap 100
59,748.15 | -1,617.75 (-2.64%)
The Midcap index underperformed the frontline benchmark, indicating rising risk-off sentiment among investors. The deeper fall points to aggressive unwinding in high-beta stocks, signaling near-term caution.
3. Nifty Smallcap 100
17,282.65 | -549.40 (-3.08%)
Smallcaps saw the steepest decline, highlighting heightened volatility and weak risk appetite. This suggests that speculative positions are being trimmed, pushing the broader market into a consolidation-to-correction zone.
Top Gainers (Nifty 500)
These stocks led the charge, delivering the highest returns this week.
Top Losers (Nifty 500)
The following stocks faced selling pressure and registered the week's biggest declines.
F&O Corner – OI Analysis
Understanding Open Interest (OI) helps gauge market sentiment and potential price movements for the next expiry.
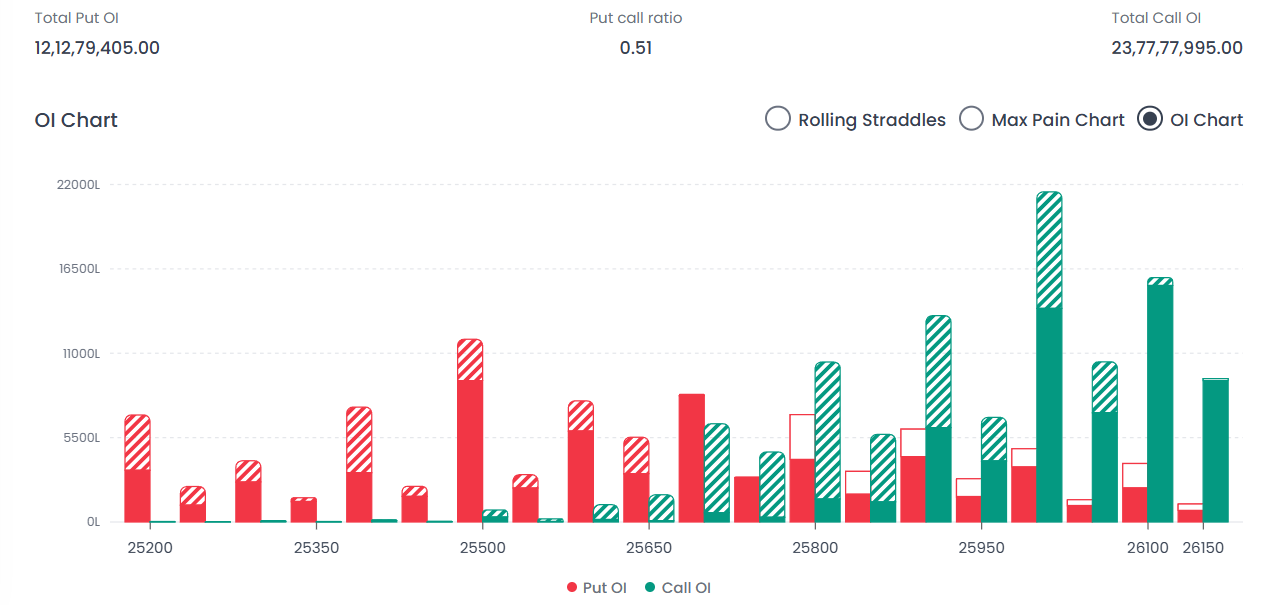
Near Resistance for the Week: 26,100(Call OI is dominant here with the tallest green bar on the chart. Significant Call writing has created a massive "Ceiling" at this level, indicating traders do not expect the market to cross this zone easily).
Near Support for the Week: 25,500(The highest Put OI is observed at this strike, indicated by the tall red bar. This serves as the primary "Floor" or safety net where buyers are likely to step in).
Put Call Ratio (PCR): 0.51Current Scenario: BEARISH
A PCR significantly below 1.0 indicates very aggressive Call writing. This suggests the market sentiment is heavily skewed towards "Sell on Rise," with bears currently controlling the trend and capping the upside.
Interpretation:The market is currently exhibiting strong bearish sentiment, clearly evidenced by the Total Call OI (23.77 Cr) being nearly double the Total Put OI (12.12 Cr). The index is facing immediate and heavy pressure from 26,000 upwards, with a stiff resistance wall at 26,100. On the downside, the first major line of defense for the bulls is at 25,500. The low PCR of 0.51 confirms that Call writers are confident, suggesting that any upside momentum is likely to be met with fresh selling unless the resistance at 26,000–26,100 is decisively broken.
Max Pain Analysis
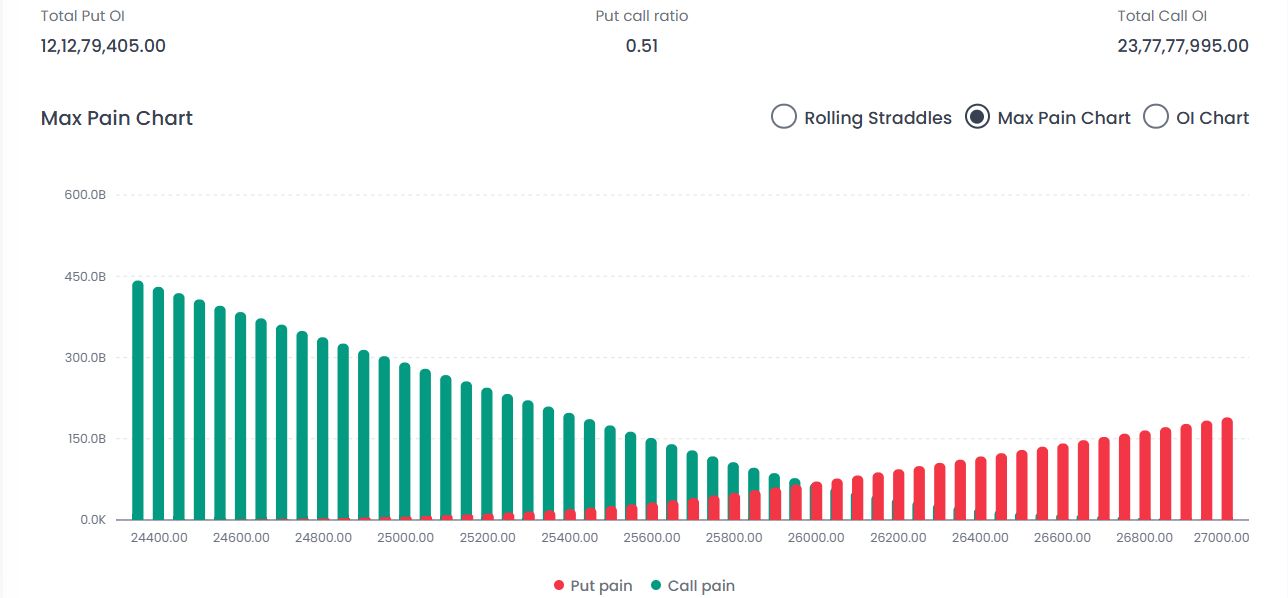
Interpretation:The Max Pain level is currently positioned at 26,000, which is noticeably higher than the market's closing price of 25,683.
The "Magnet" Effect:According to Max Pain theory, the market often gravitates toward this level by expiry to inflict the least amount of loss on Option Writers (smart money). This suggests a potential tendency for the index to attempt a pullback toward 26,000.
Conflict with Trend:However, with the market trading nearly 300 points below this level and heavy Call writing (resistance) observed at 26,100, there is a divergence. If the bearish momentum remains strong, we may see the Max Pain level itself shift lower in the coming days.
Volatility Index (India VIX)
The 'Fear Index' reflects the market's expectation of volatility.
India VIX: 10.9250 | +1.4750 (+15.61%)
Interpretation:The India VIX has witnessed a significant surge of over 15%, climbing to 10.93. Unlike previous sessions of complacency, this sharp spike indicates a rapid repricing of risk and renewed demand for hedging. While the absolute level is still relatively moderate compared to historical averages, the velocity of the rise suggests that the "low-risk" environment is shifting quickly. This expansion in volatility will lead to higher option premiums (Vega expansion), which starts to favor option buyers looking for directional moves while signaling caution to option sellers who may face sudden gamma spikes.
Major News & Upcoming Events
Major News of the Past Week
- Trump-backed 500% tariff threat on Russian oil buyers rattled Indian markets
- SEBI pulled up BofA India for insider-trading control lapses
- NSE in talks to launch India’s first natural-gas futures contract
- Jewellery stocks rallied on strong Q3 updates
- India’s FY26 GDP growth projected at 7.4%
- Trent fell nearly 9% despite strong Q3 revenue
- Mid & small-cap optimism remains long-term positive
Key Events for the Upcoming Week
📈 Indian Stock Market Last Week Graph – Explained for Beginners
The Indian stock market last week graph clearly shows:
- Breakdown from consolidation
- Increase in selling volume
- Rising volatility expansion
This is typically seen at the early stage of a corrective phase, not a long-term bear market.
Weekly Market Interpretation – Smart Money View
Weekly Trading Strategy (Educational)
For Index Traders:
- Sell on rise near 26,000–26,100
- Protect shorts below 25,500
For Option Buyers:
- Volatility expansion supports directional trades
For Investors:
- Avoid panic selling
- Focus on quality accumulation near strong supports
FAQs
1. What is meant by weekly market analysis?
Weekly market analysis is the study of stock market performance over a one-week period, focusing on index movement, sector rotation, derivatives data, volatility, and macro events to understand short-term and medium-term trends.
2. How did the Indian stock market perform last week?
The Indian stock market ended last week in a risk-off mode. Nifty 50 fell 2.45%, Midcaps declined 2.64%, and Smallcaps dropped 3.08%, indicating broad-based profit booking and a short-term corrective phase.
3. What does the Indian stock market last week graph indicate?
The Indian stock market last week graph shows a breakdown from consolidation, increased volatility, and aggressive selling pressure—signaling a short-term correction rather than a long-term trend reversal.
4. Is the weekly stock market trend bearish or bullish?
The short-term weekly stock market trend is bearish due to heavy Call writing and low PCR. However, the medium-term structure remains intact as long as key support levels hold.
5. What is the significance of PCR in weekly market analysis?
Put Call Ratio (PCR) helps measure trader sentiment. A PCR of 0.51 indicates aggressive Call writing, showing strong bearish sentiment and a sell-on-rise market structure.
6. Why did midcap and smallcap stocks fall more?
Midcap and smallcap stocks are high-beta segments. During risk-off phases, investors reduce exposure to these stocks first, leading to sharper declines compared to frontline indices.
7. How does India VIX impact weekly trading strategies?
A rising India VIX increases option premiums and favors option buyers. It also signals higher risk, requiring stricter risk management for sellers.
8. What should traders focus on in the coming week?
Traders should monitor inflation data, RBI actions, global cues, and key levels (25,500 support and 26,100 resistance) for directional clarity.
Disclaimer:This report is for informational and educational purposes only and does not constitute investment advice. Please consult a registered financial advisor before making trading or investment decisions.
Happy Trading 📊
— The Firstock Team