Weekly Market Review: Indian Stock Market Last Week (9 Feb – 13 Feb 2026)

Market Pulse: The Week in Review
The Indian equity market faced a reality check this week as the initial post-RBI policy optimism gave way to aggressive selling, particularly in the IT and Metal sectors. After a brief attempt to scale the 26,000 summit, the benchmark Nifty 50 tumbled on Friday, tracking weak global cues and concerns over AI-led disruptions in the outsourcing model.
The week concluded with a significant spike in the India VIX, which jumped over 13% on Friday alone, signaling that the "calm" phase has ended and volatility is back on the table. The broader markets, which had been resilient, also saw sharp drawdowns, with Midcaps and Smallcaps underperforming the benchmarks as risk appetite souled.
Index Performance Snapshot
A quick review of the major indices for the week ending February 13, 2026.
1. Nifty 50
25,471.10 | -222.60 (-0.87%)
The Nifty 50 faced a challenging week, failing to sustain its early momentum and eventually slipping below the crucial 25,500 support on a weekly closing basis. The price action formed a bearish "Lower High, Lower Low" pattern on the daily charts, indicating that sellers are gaining the upper hand. With the 26,000 mark acting as a formidable psychological ceiling, the index may now look to test the 25,200–25,300 zone to find fresh buying interest.
2. Nifty Midcap 100
59,438.00 | -64.70 (-0.11%)
The Midcap index remained largely resilient compared to the frontline stocks, closing with a marginal cut of 0.11%. While it avoided a deep drawdown this week, the index is showing signs of exhaustion near its recent peaks. Traders are adopting a "wait-and-watch" approach; however, a decisive move below the 58,000 support level could trigger a broader bout of technical weakness across the sector.
3. Nifty Smallcap 100
17,032.90 | +94.25 (+0.56%)
In a surprising divergence, the Smallcap index managed to end the week in the green with a gain of 0.56%. Despite intra-week volatility and profit-booking in several pockets, the index successfully defended the 17,000 psychological mark. While this outperformance is encouraging, the structure remains sensitive; any breach of the 17,000 support could lead to a quick slide toward the 16,700 levels.
Top Gainers & Losers (Nifty 500)
Weekly Gainers
Weekly Losers
F&O Corner
OI Analysis (February 17 Expiry)
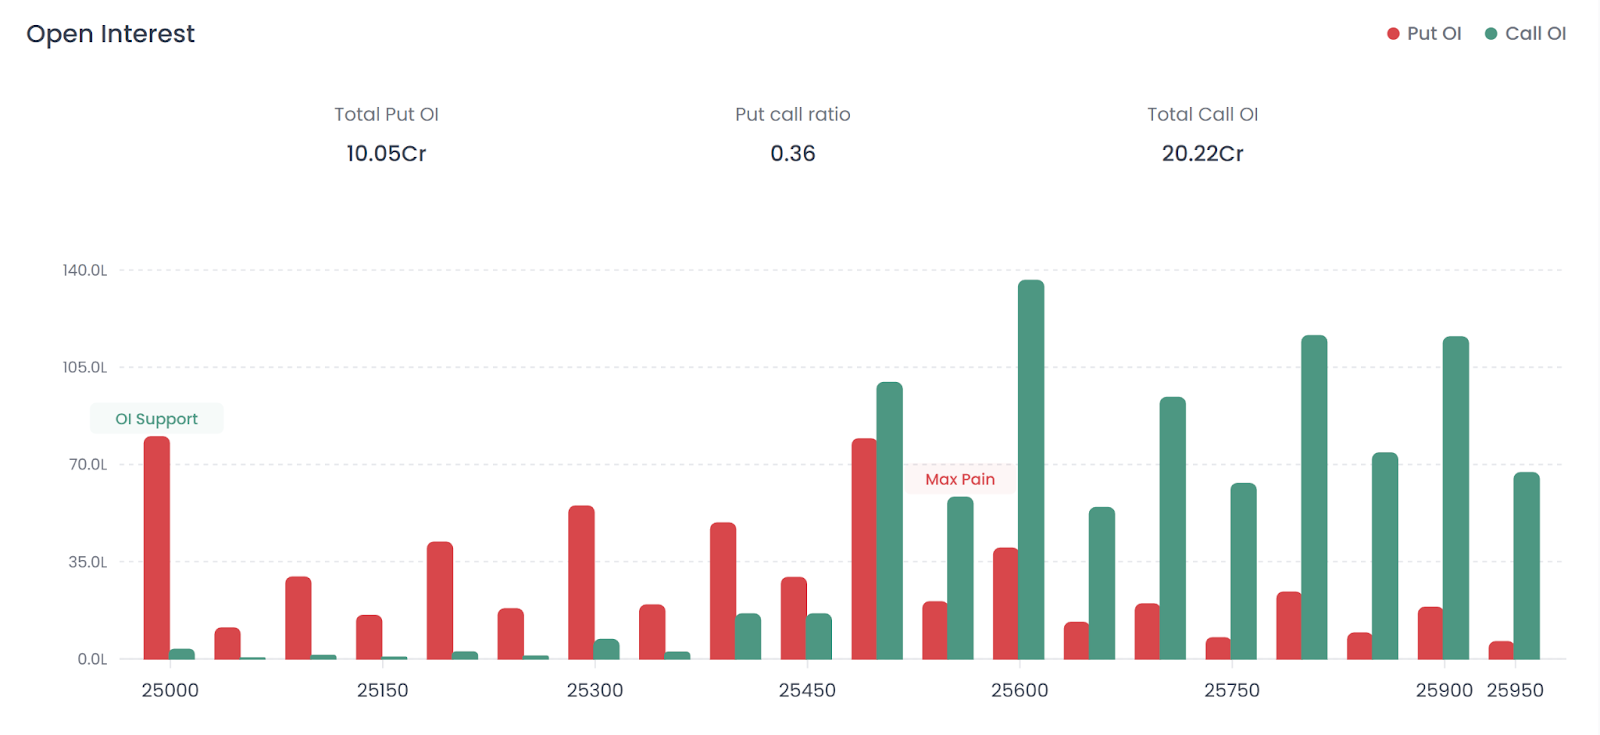
Resistance: The 26,000 Call strike remains the absolute "Ceiling" with massive open interest, as seen in the charts. Call writers were aggressive on Friday, shifting their positions lower to 25,800.
Support: Significant Put writing is seen at 25,000, which now acts as the major floor. Immediate support based on OI is at 25,300.
Put Call Ratio (PCR): 0.36 | Current Scenario: BEARISH / OVERSOLD
Interpretation: A PCR of 0.36 is extremely low, indicating that the market is heavily dominated by Call writers. While this is bearish, such low levels often trigger a short-covering bounce as the market becomes technically "oversold."
Max Pain Analysis
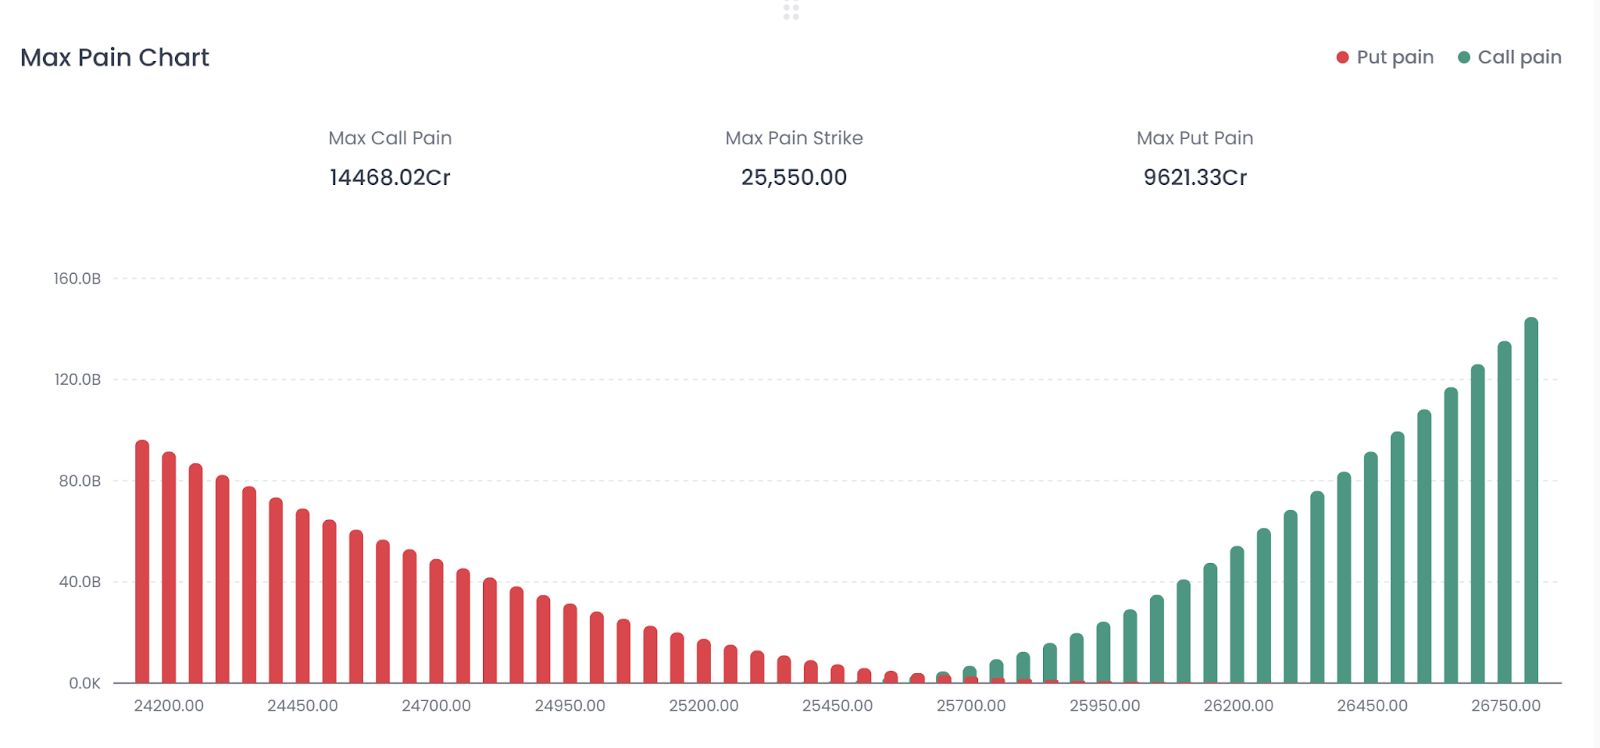
Max Pain Strike: 25,550.00
Interpretation: With the Nifty closing at 25,471, it is currently trading below the Max Pain level. This suggests that if the index recovers toward 25,550, option sellers would experience the least "pain" at the upcoming expiry.
Volatility Index (India VIX)
India VIX: 13.29 | +1.3525 (+11.33%)
Interpretation: The VIX has spiked sharply from the sub-12 levels seen last week. The 11.33% weekly rise (and 13% intraday spike on Friday) indicates that "Fear" has returned. This move marks the end of the recent complacency and suggests wider trading swings in the coming week.
Weekly Market Structure Summary
Major News & Upcoming Events
- IT Sector Meltdown: Concerns over rapid AI advances affecting Indian IT outsourcing models led to over 5% drop in the IT index on Thursday.
- Metal Prices Sink: A sharp drop in global metal prices weighed heavily on stocks like Hindalco (down 6%) and Hindustan Copper.
- CPI Base Year Revision: India's retail inflation stood at 2.75% for January under the new series (2024 base year), providing some relief on the macro front.
- Earnings Impact: Mixed Q3 results from mid-caps showed revenue strength but significant margin pressure due to rising expenses.
Weekly Market Technical Summary
This weekly market analysis confirms:
- Breakdown below key 25,500 support
- Rising volatility (India VIX above 13)
- Extremely low PCR (0.36) signaling oversold conditions
- 26,000 remains strong weekly stock market resistance
The stock market weekly structure now leans bearish unless a strong recovery above 25,800 emerges.
Indian Stock Market Last Week Graph – Key Levels to Watch
If plotting the Indian stock market last week graph, the structure would show:
- Lower High near 26,000
- Breakdown below 25,500
- Support cluster at 25,300–25,000
- Volatility spike on Friday
This suggests that last week’s market structure reflects distribution rather than accumulation.
Weekly Stock Market Outlook
- Immediate Resistance: 25,800
- Major Resistance: 26,000
- Immediate Support: 25,300
- Major Floor: 25,000
- Bias: Bearish but Oversold
A recovery toward 25,550–25,800 could emerge due to short-covering, given the extremely low PCR.
FAQs
1. How did the weekly market perform last week?
The weekly market closed lower, with Nifty falling 0.87% and breaking below 25,500 support.
2. Why did the weekly stock market fall?
The decline was driven by heavy IT selling, weak global cues, falling metal prices, and AI disruption concerns.
3. What does a PCR of 0.36 indicate in the stock market weekly report?
A PCR of 0.36 indicates extreme bearish positioning, often signaling oversold conditions and potential short-covering.
4. Is volatility rising in the Indian stock market last week?
Yes. India VIX surged over 11% weekly, marking a return of volatility.
5. What is the key level for the upcoming weekly market?
The 25,500–25,550 zone is critical. Recovery above 25,800 is needed to neutralize bearish pressure.
Disclaimer: This report is for informational purposes only and does not constitute financial advice. Please consult your financial advisor before making any investment decisions.
Happy Trading! The Firstock Team