What Is Volume in Stock Market? Beginner to Pro Guide 2026
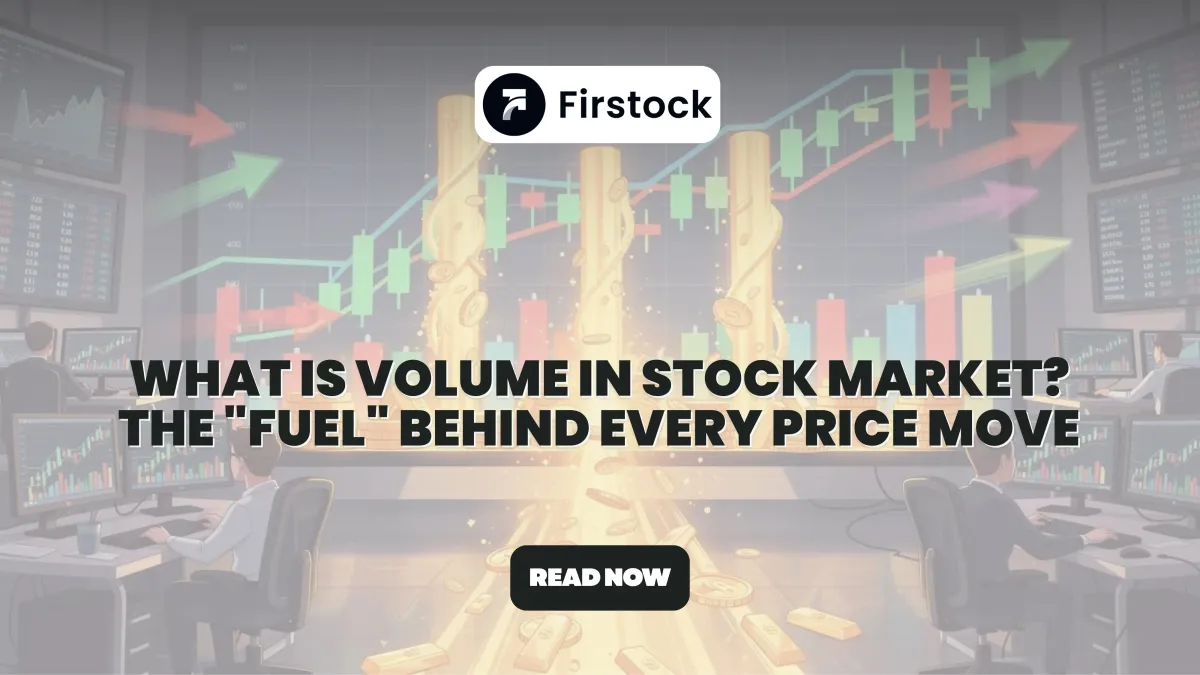
What Is Volume in Stock Market? The “Fuel” Behind Every Price Move
Volume in stock market refers to the total number of shares or contracts traded in a stock or index during a specific period. It shows how many market participants are involved in a price move and helps traders confirm whether the move is strong, weak, real, or fake.
Introduction: Why Volume Matters More Than You Think
Imagine buying a car. You wouldn’t just admire the shiny exterior paint—you would check the engine to see if it actually has power.
In the stock market: Price is the exterior paint. Volume is the engine.
Many beginners obsess over price charts—green candles, red candles, breakouts, and indicators. But they often ignore the single most important factor that validates whether a move is genuine or misleading: volume in stock market.
Without volume, a price trend is like a car running on fumes—it may move briefly, but it won’t go far.
In this in-depth guide, you’ll clearly understand:
- What is volume in stock market
- How trading volume in stock market separates real buying from noise
- How stock volume trading helps you avoid fake breakouts and traps
- How professionals use volume to confirm trends, reversals, and breakouts
What Is Volume in Stock Market?
Volume is the total number of shares or contracts traded (bought and sold) for a specific security during a specific time period.
The Logic (Simple Example)
If Raj buys 100 shares of Reliance from Firstock - Trading App , the volume is 100, not 200. Volume counts the transaction, not the number of people involved.
The Measurement
On a stock chart, volume appears as vertical bars at the bottom:
- Taller bars = higher participation and interest
- Shorter bars = low activity and weak conviction
Why Does Volume Matter?
Think of volume as voting power.
- If a stock rises 5% with low volume, only a few traders voted for that price. The move is weak.
- If a stock rises 5% with high trading volume in stock market, thousands of traders voted with real money. The move is strong.
This is why professional traders never analyze price without volume.
Trading Volume in Stock Market: Noise vs Real Buying
Not all volume is equal—especially in the Indian stock market (NSE/BSE).
Traded Volume
- Total shares traded during the day
- Includes intraday traders who buy at 9:15 AM and sell at 3:30 PM
- Largely speculative
- Often considered noise
Delivery Volume (The Real Data)
- Shares actually delivered to demat accounts
- Indicates long-term intention
- Reflects real conviction and accumulation
The Strategy That Professionals Use
- High traded volume + low delivery percentage (10–15%) → Speculative activity, risky to hold
- High traded volume + high delivery percentage (50–60%) → Institutional accumulation (FIIs/DIIs), strong signal
If you ignore delivery data, you’re trading blind.
Stock Volume Trading: The Price–Volume Relationship Cheat Sheet
The secret of successful stock volume trading is understanding the relationship between price and volume.
This single table explains 80% of volume behavior in the stock market.
Volume Spikes: Spotting Market Tops and Bottoms
Sometimes you’ll notice a single volume bar that is 5x or 10x larger than usual. This is called a volume climax.
Volume climaxes usually signal the end of a trend, not the beginning.
1. Buying Climax (Market Top)
- Occurs after a long uptrend
- Huge volume spike
- Price stalls or forms a Doji candle
What’s happening? Smart money sells to late retail buyers driven by FOMO. The fuel is exhausted. A correction or crash often follows.
2. Selling Climax (Market Bottom)
- Happens after a sharp fall
- Massive red candle with record volume
What’s happening? Weak hands panic sell. Smart money quietly accumulates at discounted prices. A reversal becomes highly probable.
The Breakout Test: Real vs Fake Breakouts
One of the most practical uses of trading volume in stock market is identifying fake breakouts.
Scenario
A stock breaks a major resistance level at ₹500.
The Only Question That Matters
Is the volume significantly higher than the average of the last 10–20 sessions?
- Yes → Valid breakout, institutional participation, buy
- No → False breakout (trap), avoid
Most retail traders lose money by buying breakouts without volume confirmation.
The Red vs Green Volume Bar Myth
Many beginners believe:
- Green volume bar = buyers are winning
- Red volume bar = sellers are winning
This is wrong.
For every buyer, there is always a seller.Volume is neutral.
The color of the volume bar usually just matches the candle color. What truly matters is the height of the bar, not its color.
A tall red bar and a tall green bar both indicate strong activity and interest.
Volume and Liquidity: Why It Directly Affects Your Profit
When asking what is volume in stock market, you are also asking about liquidity.
High-Volume Stocks
- Easy to buy and sell
- Tight bid–ask spread (e.g., Buy 100.05 / Sell 100.00)
- Lower slippage and lower risk
Examples: Large-cap stocks like Tata Motors, SBI
Low-Volume Stocks
- Difficult entry and exit
- Wide bid–ask spread (e.g., Buy 105 / Sell 95)
- High slippage and manipulation risk
This is why professionals avoid illiquid penny and SME stocks.
Best Volume Indicators for 2025
You don’t have to rely only on volume bars. These tools help you analyze volume more deeply on Firstock - Discount broker in India :
VWAP (Volume Weighted Average Price)
- Widely used by intraday traders
- Shows the average price weighted by volume
- Price above VWAP = bullish control
- Price below VWAP = bearish control
OBV (On-Balance Volume)
- Cumulative volume indicator
- Adds volume on up days, subtracts on down days
- Rising OBV with flat price often signals an upcoming breakout
Volume Across Different Time Frames
Understanding volume changes with time frames improves accuracy:
- 5–15 minute volume → Intraday trading
- Daily volume → Swing trading
- Weekly volume → Positional and long-term investing
Always analyze volume in the same time frame as your trade.
Volume and Modern (AI-Based) Trading
Institutional and algo-based trading systems rely heavily on:
- Volume-weighted logic
- VWAP-based execution
- Accumulation and distribution patterns
Price patterns without volume confirmation are often ignored by smart systems.
Conclusion: Volume Is the Market’s Truth
Price can be manipulated. News can be misleading. But volume in stock market never lies.
It tells you exactly where the real money is flowing.
Next time you see a stock jumping 10%, don’t just look at the green candle. Look at the volume bar below it.
- Small volume → fake move
- Large volume → real conviction
Next Step
Log in to Firstock - Option Trading App, open the chart of your favorite stock, and add the Volume indicator. Check whether recent price moves are supported by real trading volume or not.
FAQs
1. What is considered high volume in stock market?
There is no fixed number. Volume is considered high when it is 1.5x to 2x higher than the stock’s 20-day average volume.
2. Does high volume always mean price will go up?
No. High volume only means high participation.
- High volume + green candle = aggressive buying
- High volume + red candle = aggressive selling
3. Can volume predict market crashes?
Yes. Rising prices with falling volume (divergence) often appear before major market corrections.
4. Why is volume low during lunchtime?
Institutional traders are most active during the first hour (9:15–11:15) and last hour (2:30–3:30). Midday participation is lower.
5. Is volume more important than indicators?
Volume validates indicators. Indicators without volume confirmation are unreliable.
6. Is low volume bad for beginners?
Yes. Low volume increases slippage, manipulation risk, and false signals.
Disclaimer: The content should not be construed as investment, trading, or personal financial advice. This article is for educational purposes only.